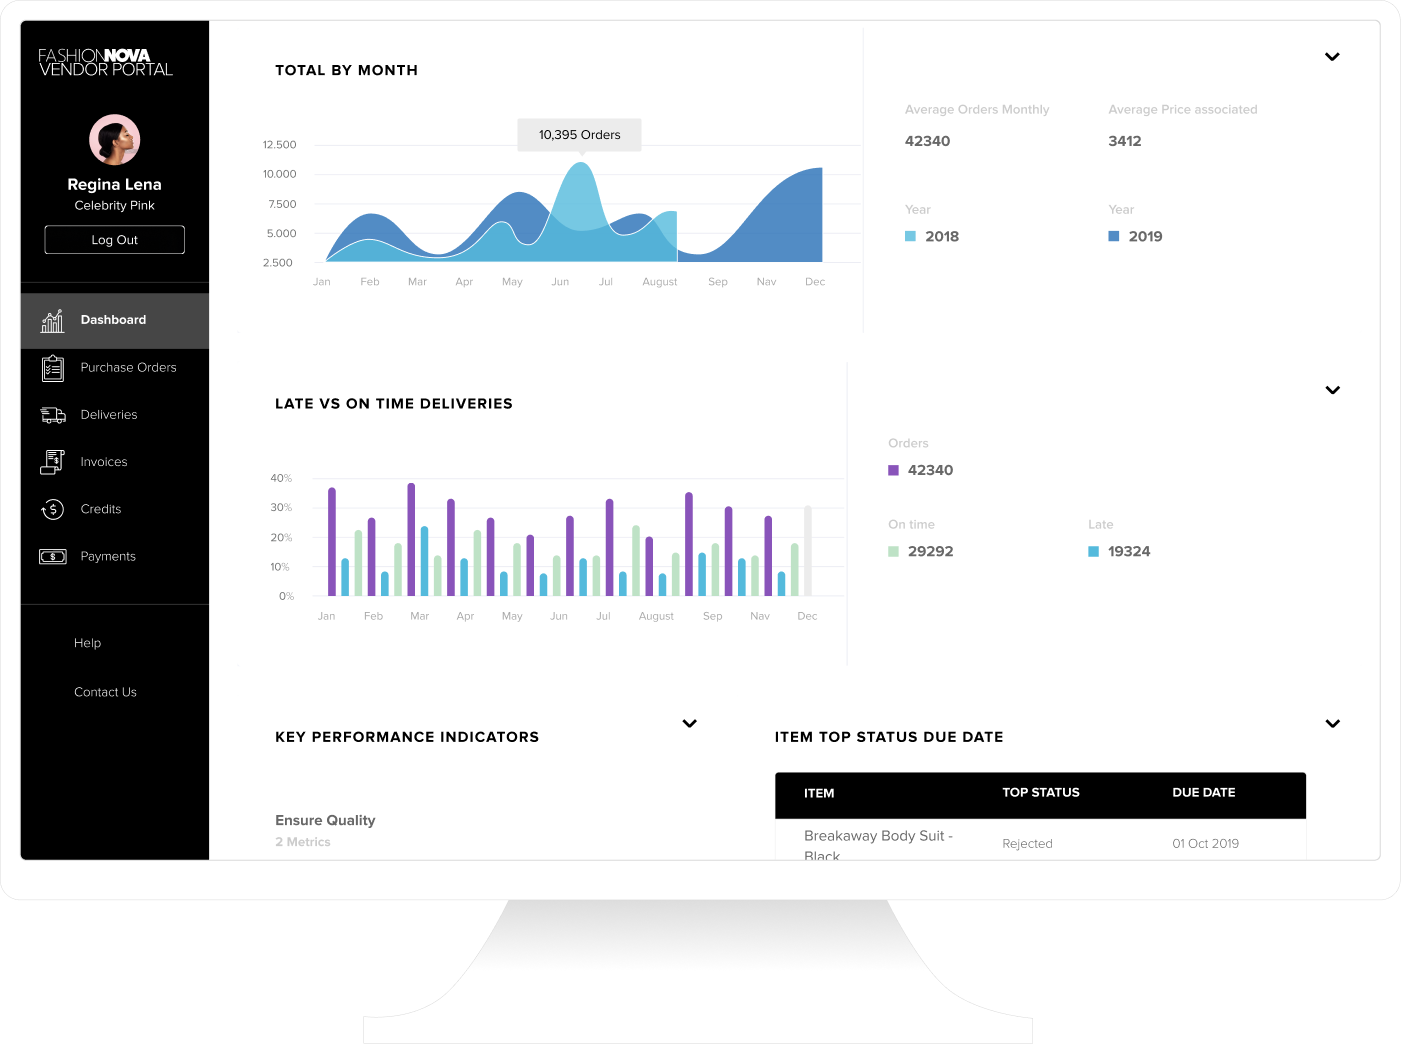
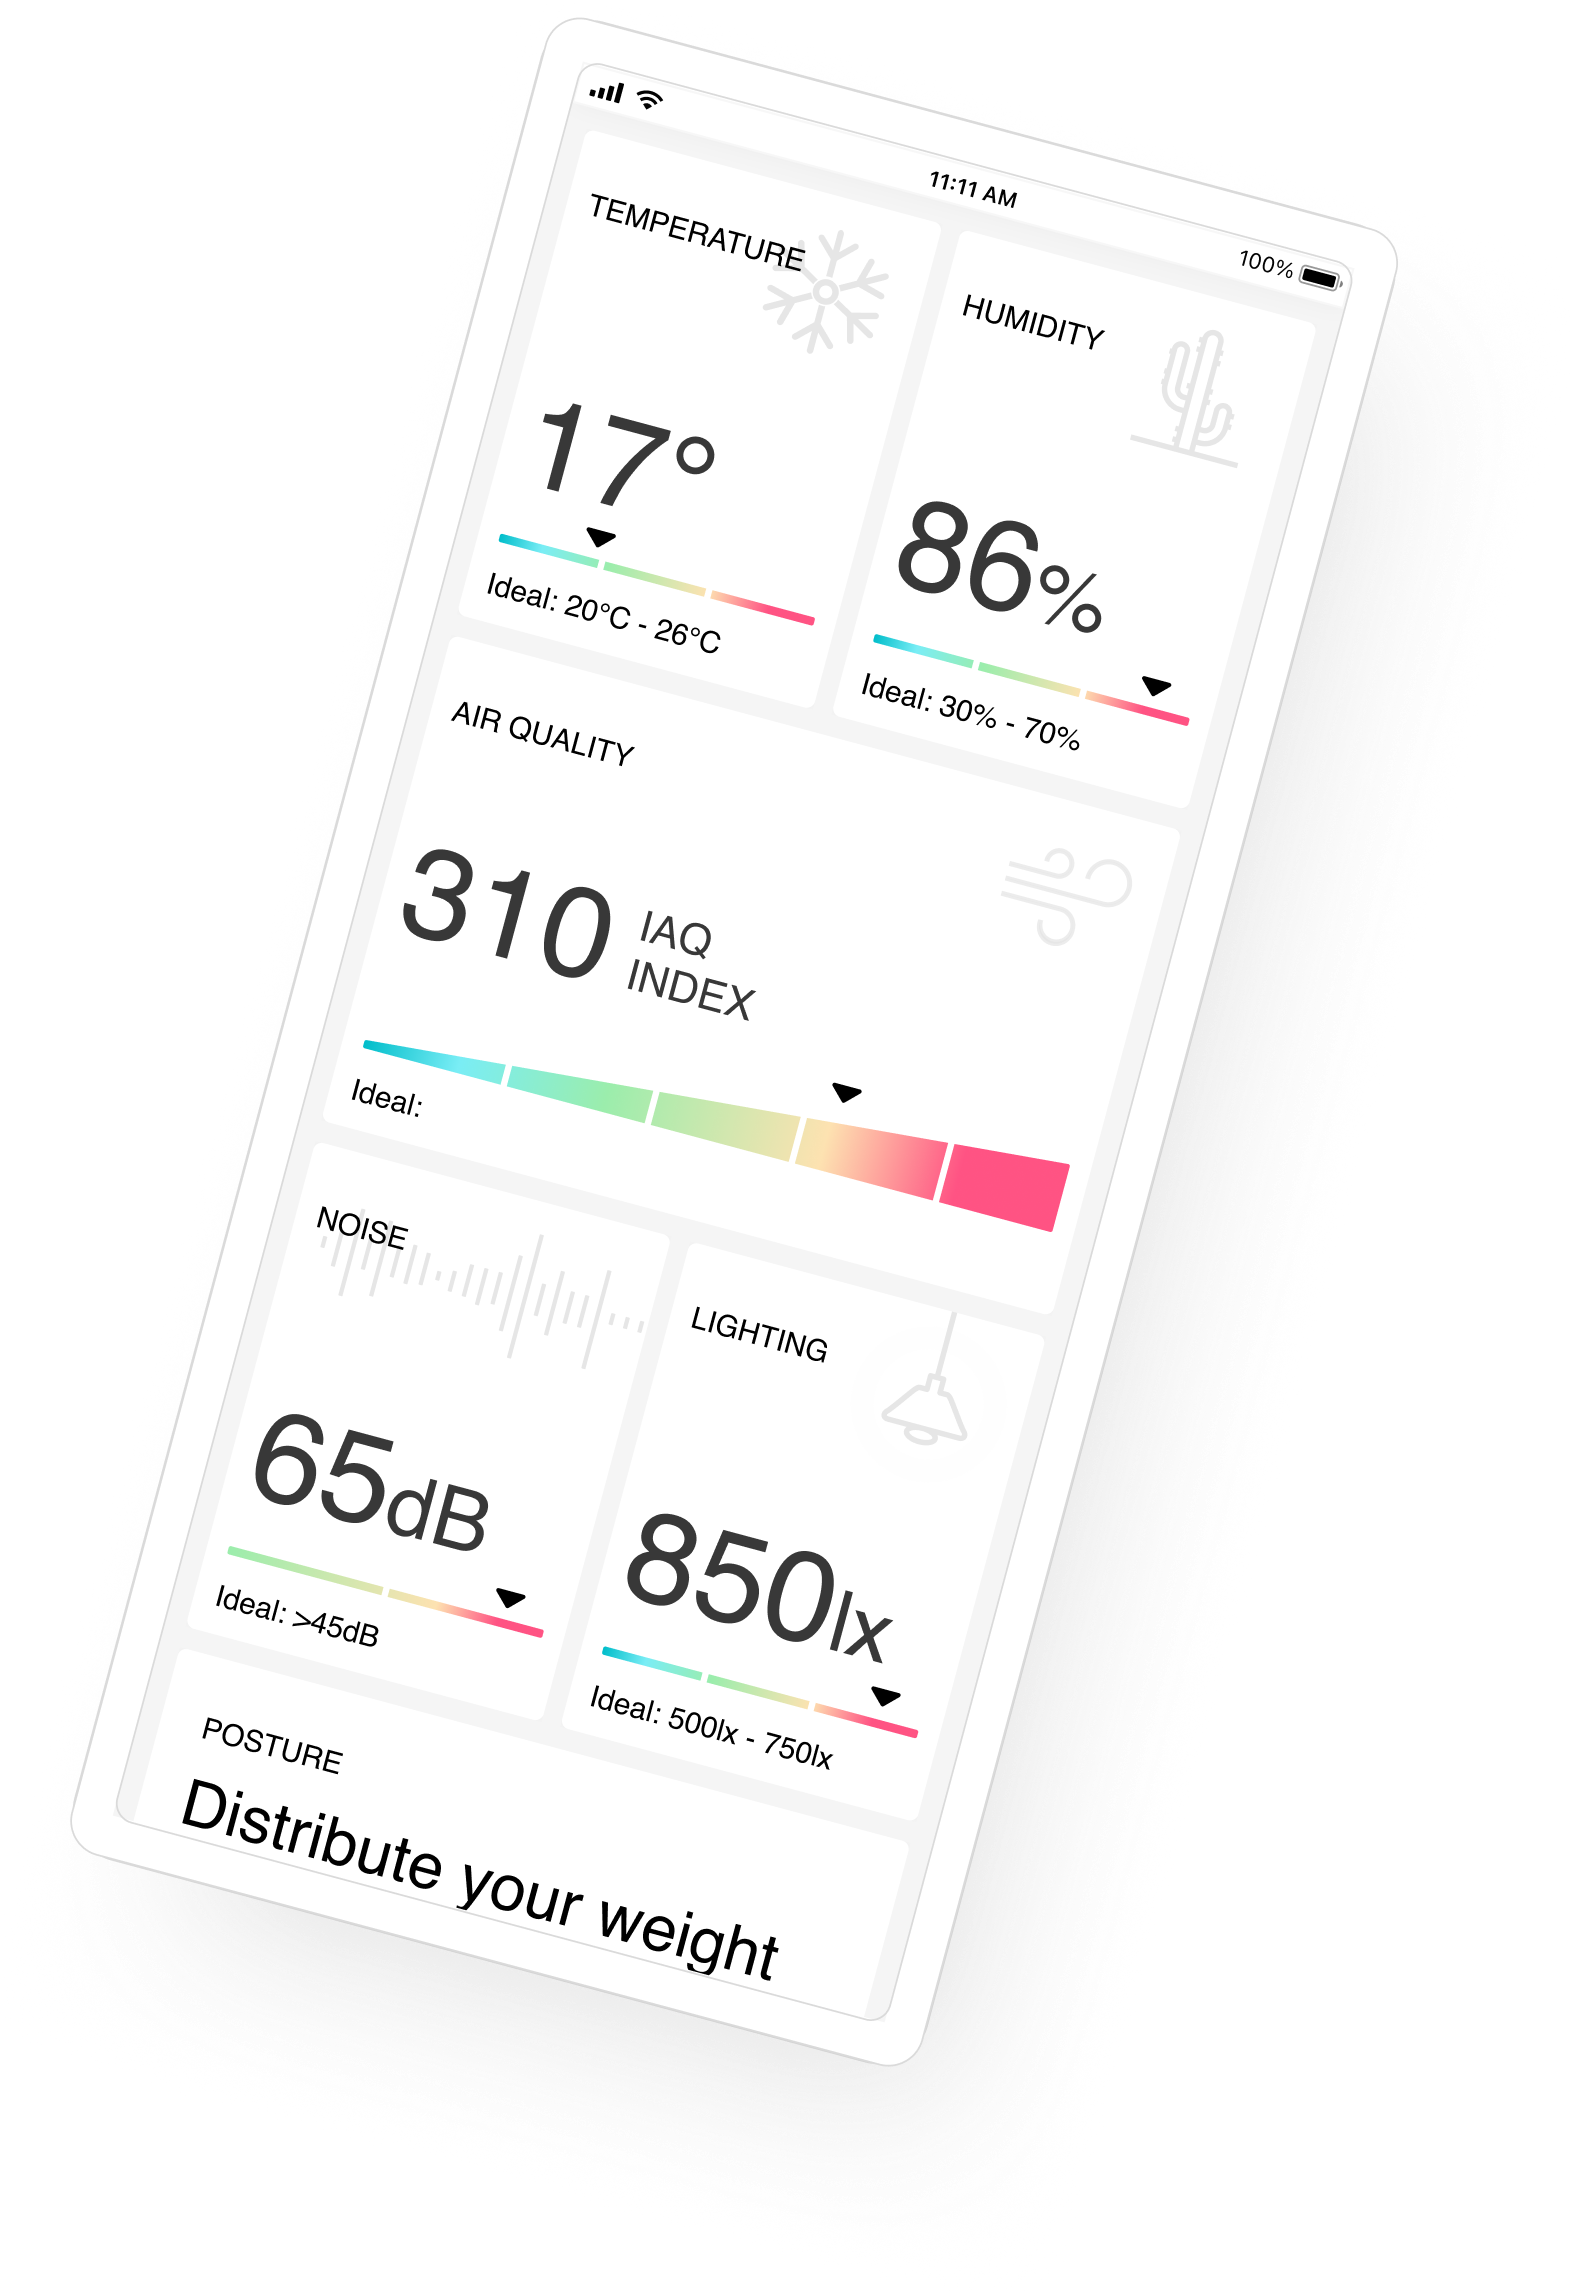
Numerex iManage is a SaaS big data & predictive analytics solution. It allows manufacturing companies to increase visibility in its supply chain by identifying optimal product deployment and leverages that information to provide advanced data analytics.
It manages machine-to-machine (M2M) by tracking devices with location reporting by wireless network connectivity and a cloud-based application (IoT).





WHAT IS NUMEREX - iManage
Industry-leading manufacturing companies engage multiple suppliers to regularly ship containers to various locations. In order to keep the supply chain working smoothly and without delays, Numerex iManage places tracking devices on shipping containers to collect data from their locations, estimate delivery times, set alerts for supply-chain delays, and generate reports.
If the supply chain is delayed, product shipments get affected in cascade, causing significant operational and production costs, thus reducing margins and revenue. iManage allows companies to better allocate resources, increase production efficiency by preventing losses, delays, unnecessary acquisition of inventory, carrying costs, and expediting expenses.
THE GOAL
Numerex tasked my team with designing and developing new features which would allow the cloud-based application to generate real time-reports, alerts, notifications, customized views, and advanced data analytics to help their users perform daily tasks better.
1. Reduce navigation complexity
The Numerex application grew organically over time, adding new features and sections to the sitemap. This created a complex learning curve for new employees and technical debt for the tech team.
2. Cut resolution time
Understanding user journeys and needs to reduce the amount of steps required to solve urgent tasks was the priority. From there we could define alerts, notifications, and required customizations to accelerate the decision-making process.
3. Ensure scalability & Optimize performance
Make it flexible and scalable for the future. Optimize performance for multiple devices.
STRATEGY & PLANNING
MY TEAM
MY CORE RESPONSIBILITIES


ROADMAP
The Project Manager, our Client Stakeholder, and I had various meetings to define the business goal as well as success indicators, groom the backlog, prioritize tasks, and define the roadmap.

RESEARCH TECHNIQUES
To dive deep into the problems and needs from our users, I ran affinity groups facilitated with my client stakeholder, researched the different type of information that was available for live updates, reviewed manager's reports and audited the user interface searching for inconsistencies, different nomenclature, and repeated information.

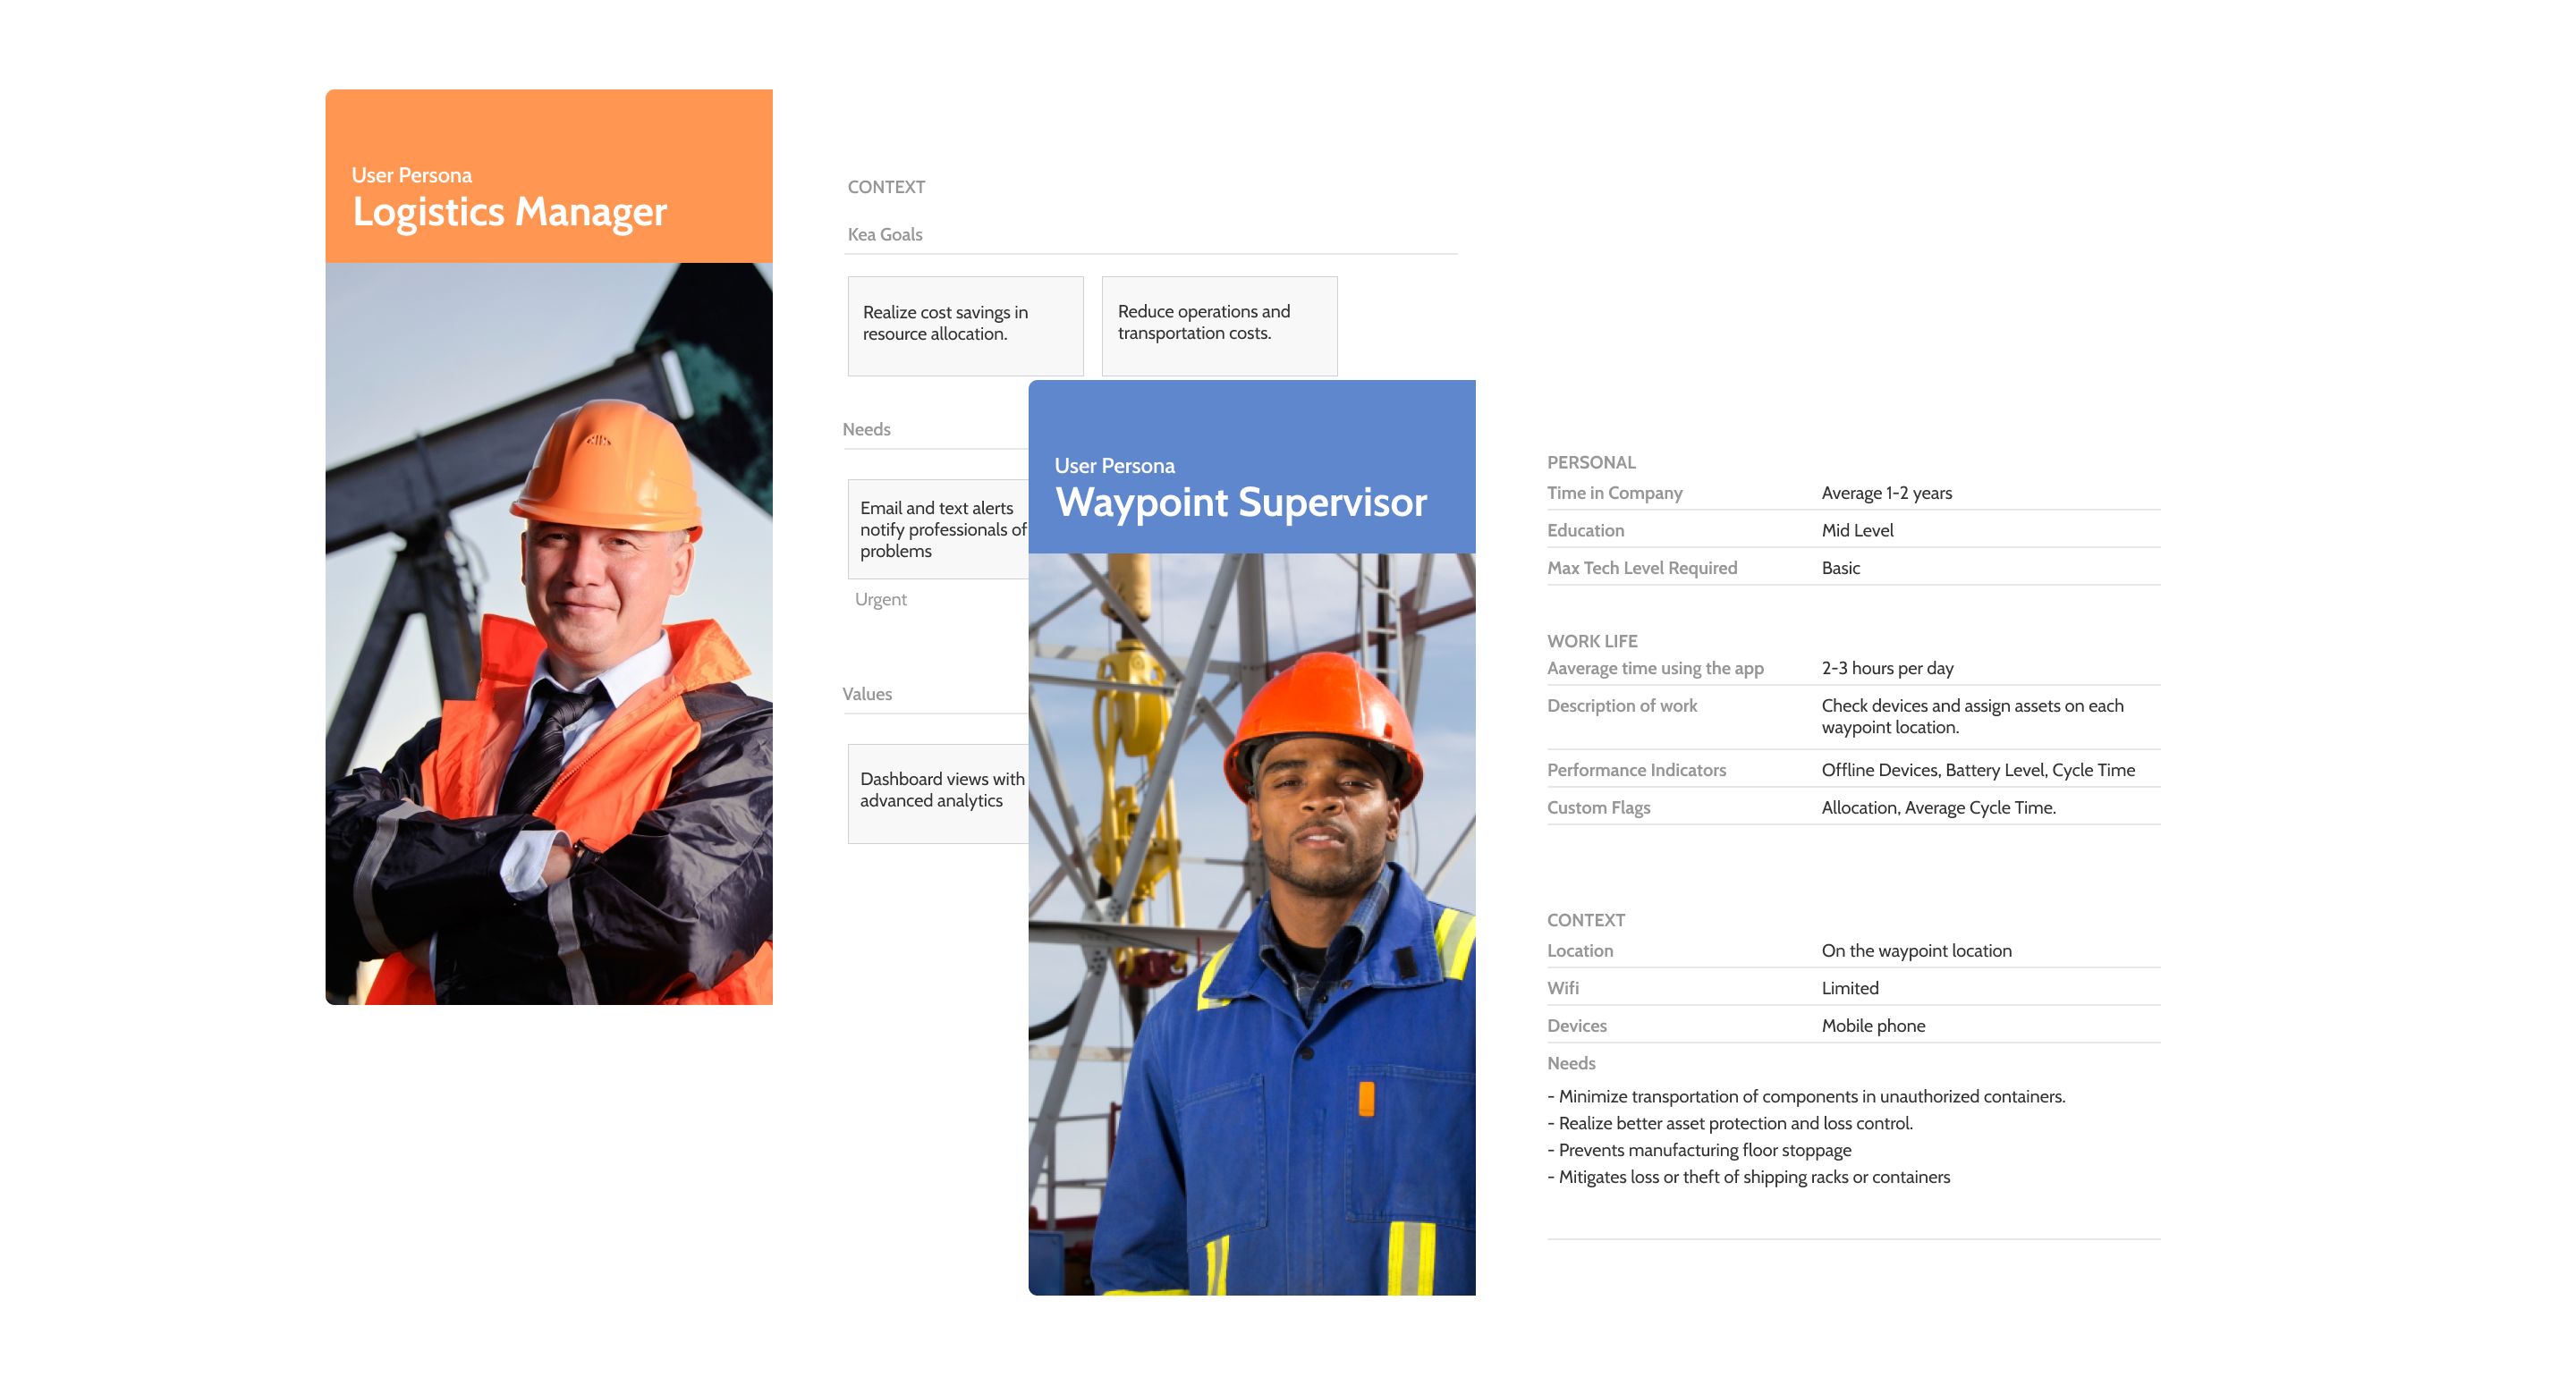
USER PERSONAS
The client stakeholder gathered customer feedback to help me identify the user personas: Logistics Manager and Waypoint Supervisor.
AUDIT USER INTERFACE
Together we mapped on the most common user journeys the top pain points, the type of information highlight each persona required, and the most requested filters and modifications.
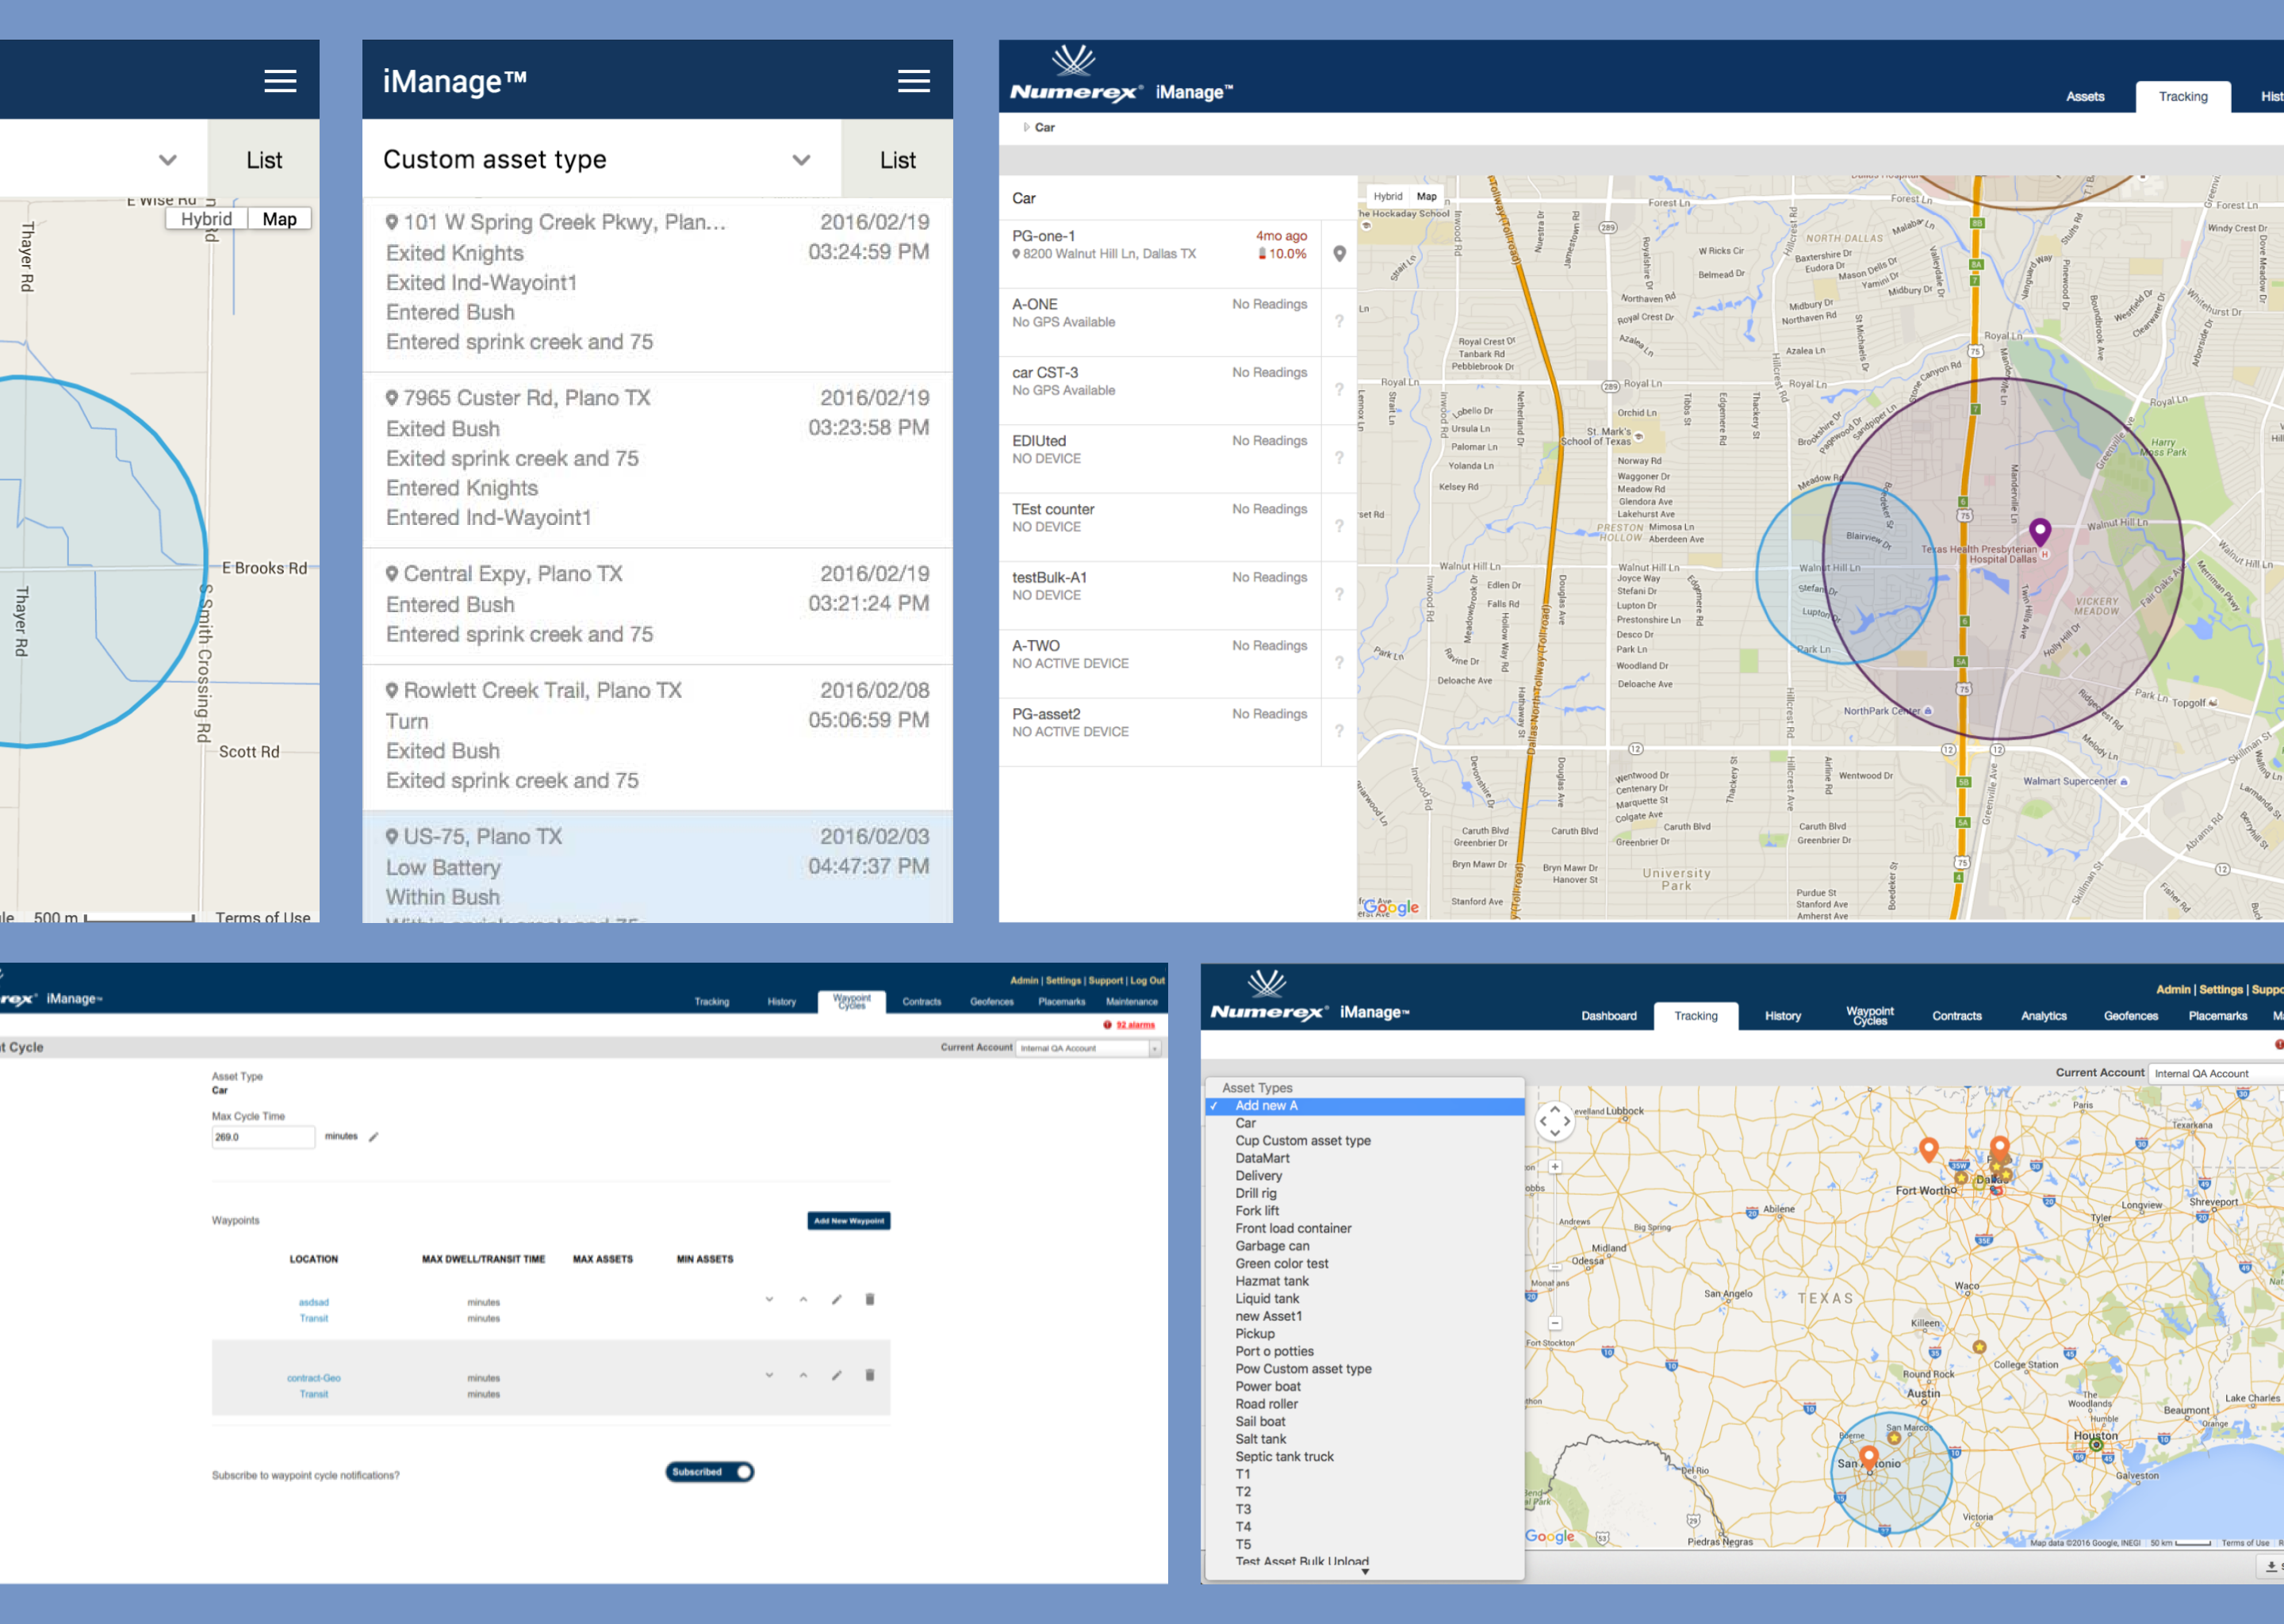
Working with Numerex presented me with a very complex challenge: understanding the information architecture and how single pieces of data relate to each other within different levels of the sitemap. How that is used and understood by different users, what are the common complaints per user group and what are the product vision plans to support an architecture that supports strongly for future changes.
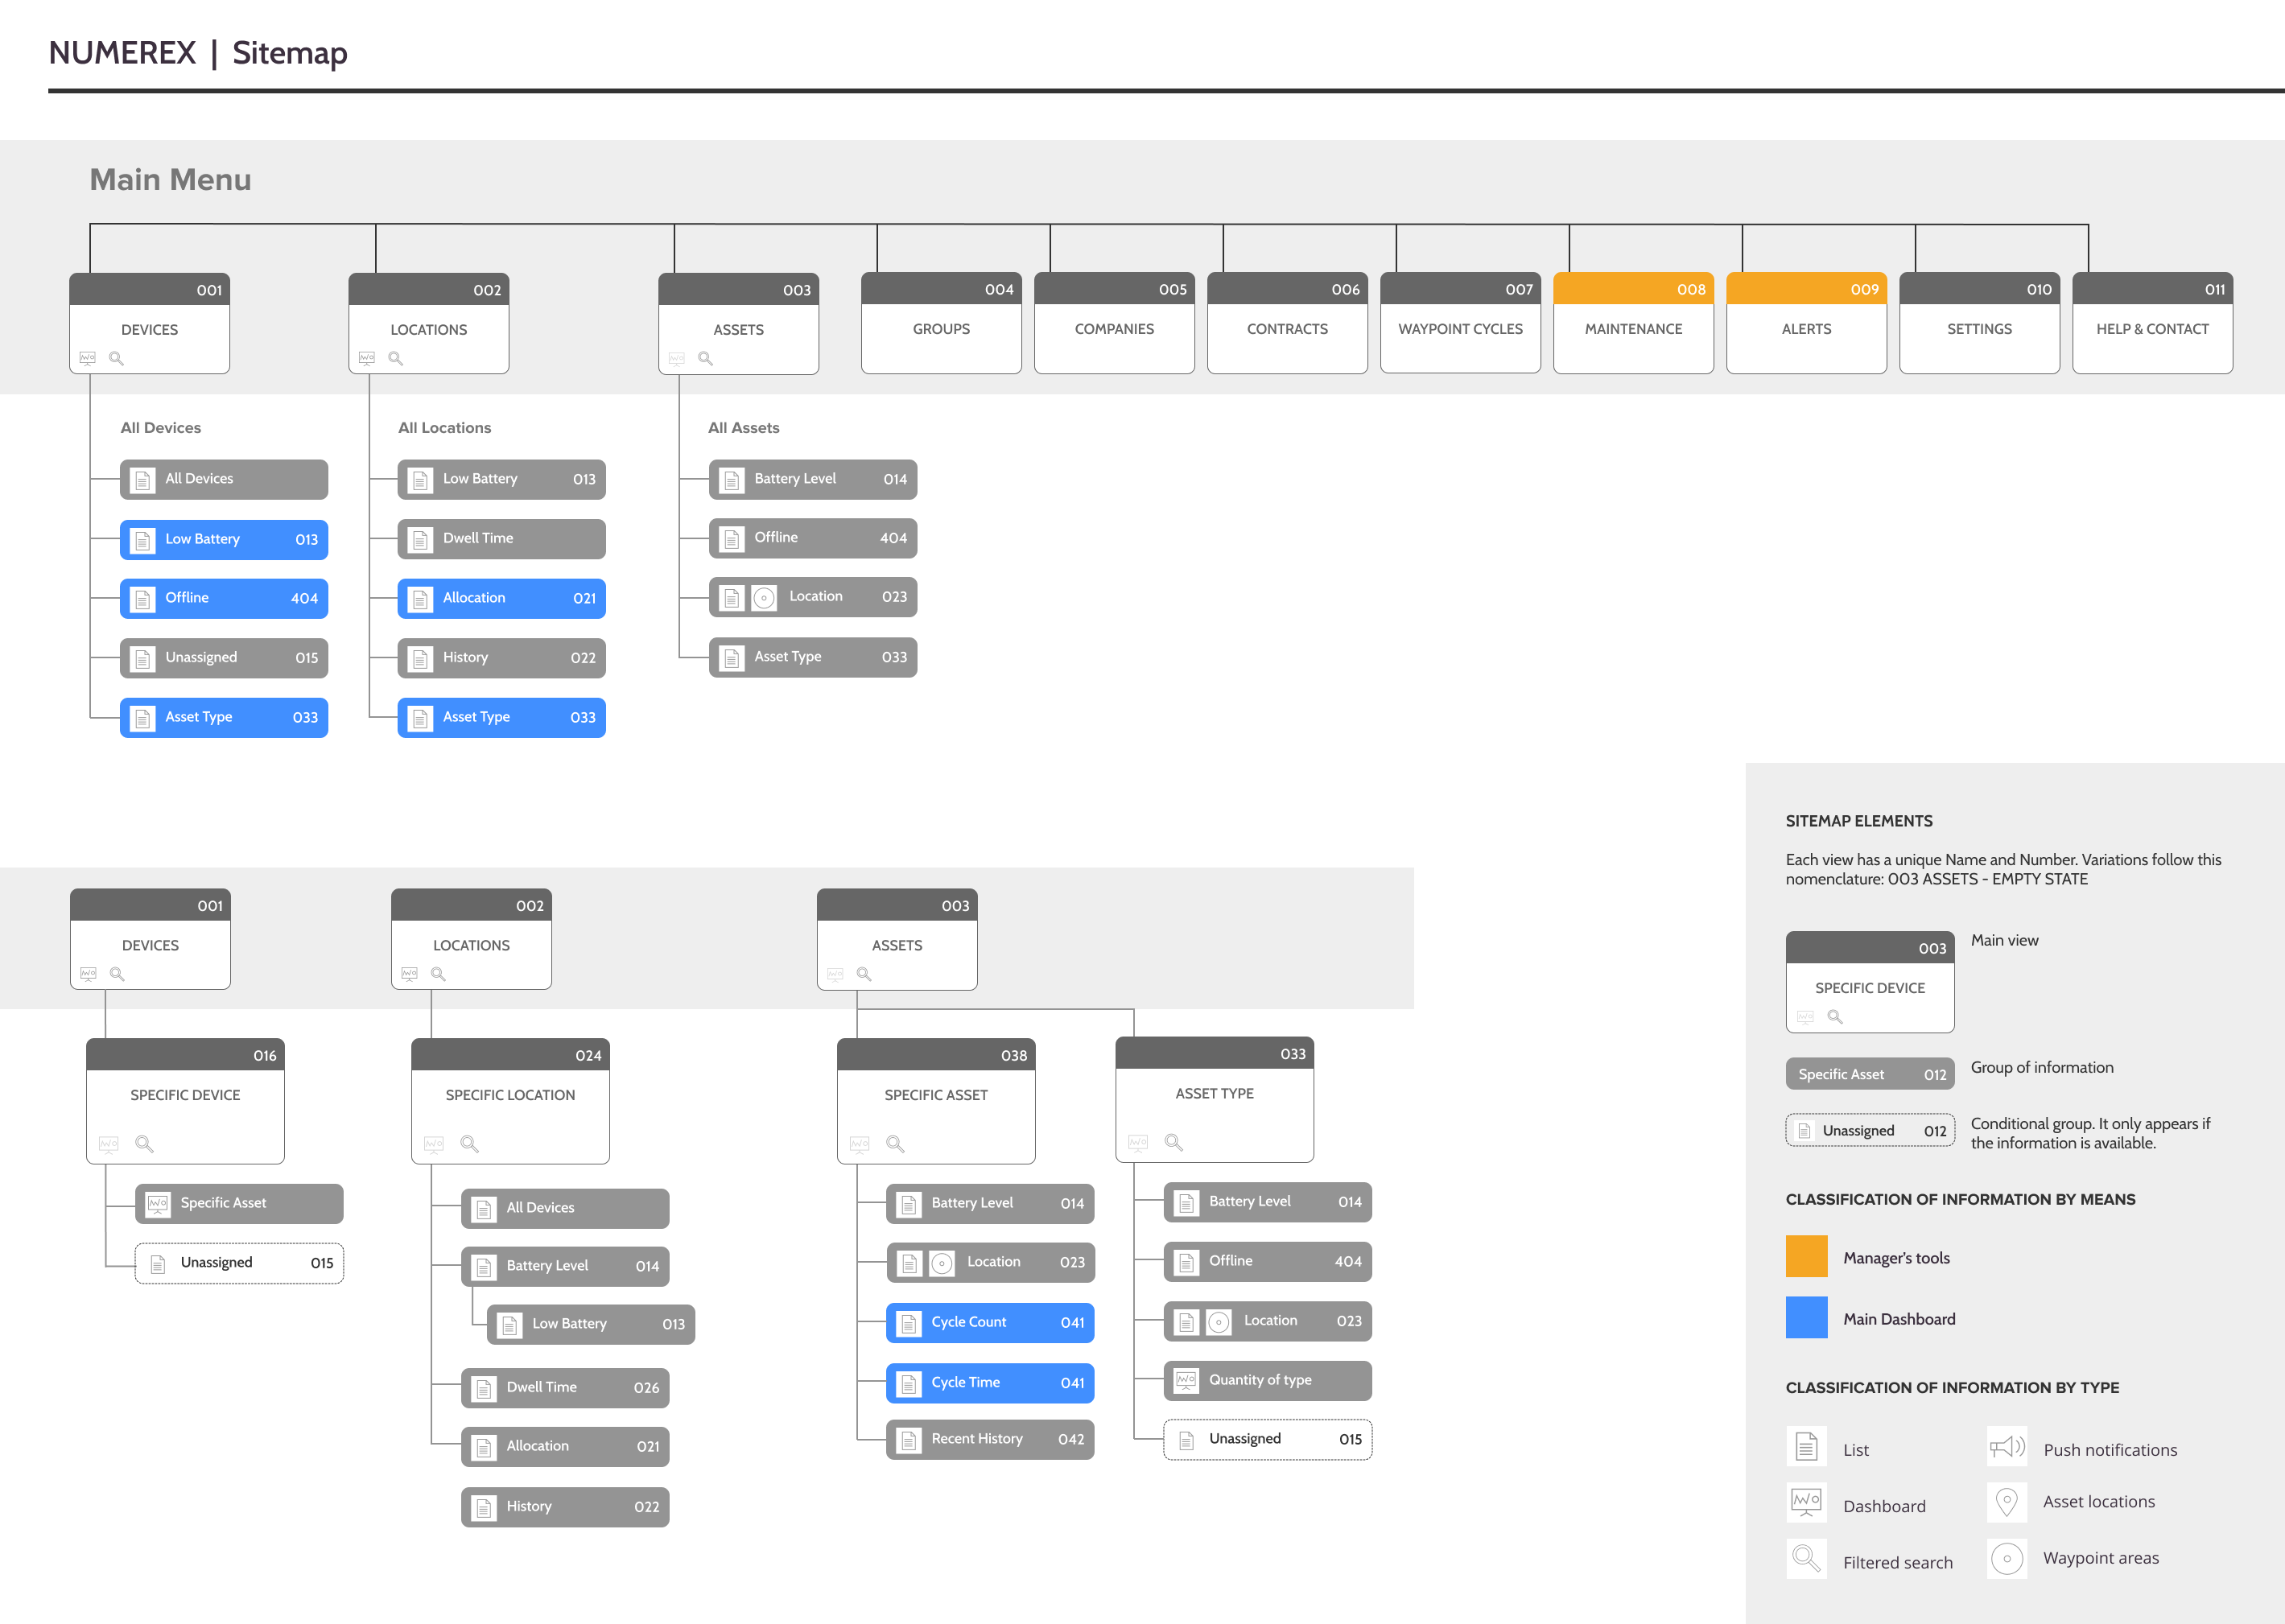
To understand what would be the most logical taxonomy for current users I designed a sitemap and architecture research across all levels of the architecture.
KEY LEARNINGS
I identified the clear-cut data needed, requests for easy-to-understand data visualization, highlights alerts, and important messages. Providing this info would facilitate the reduction of costs and overall time spent generating and exporting reports. By meeting with my dev team they reported the current status of the codebase, feasibility and blockers for new designs. The given architecture of the Numerex did not supported user profiles and permissions.


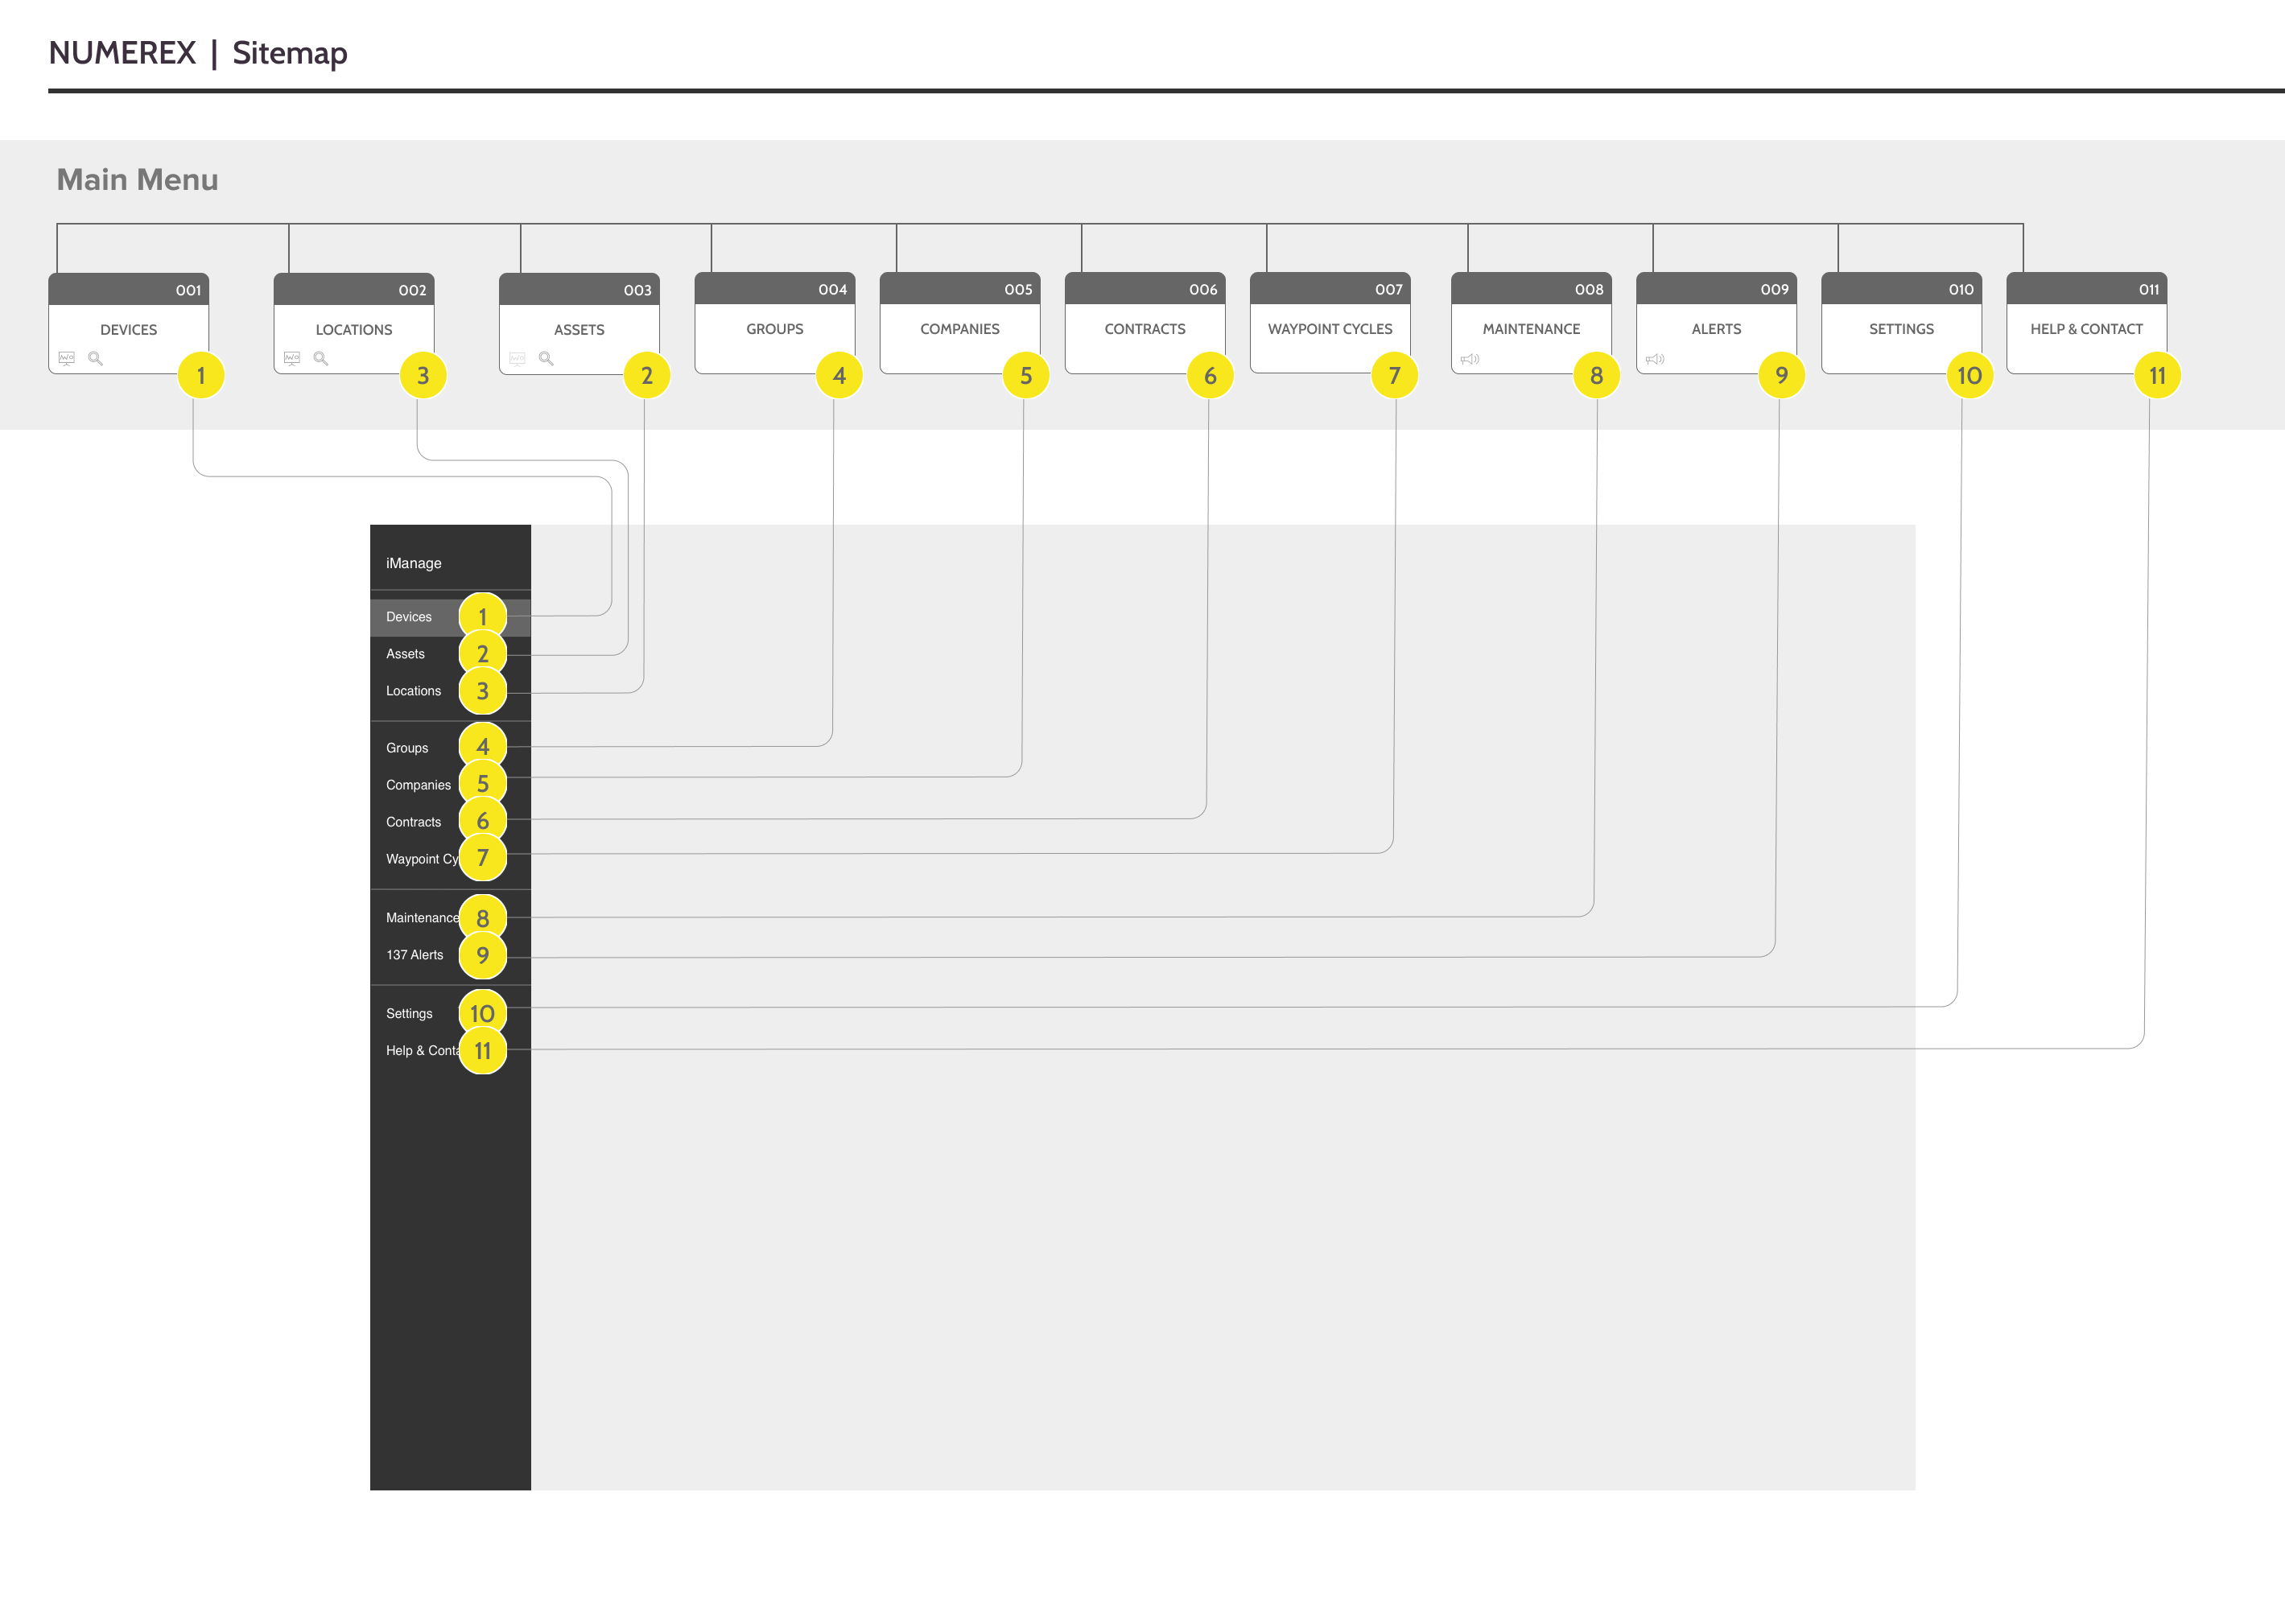
SITEMAP REDESIGN
I articulated a solution that restructured the whole architecture of the navigation.
BRANDING
Numerex already had branding principles, but guidelines were not formally documented. Part of my job was to collect the partitioned pieces, document the Design System and evangelize the Tech team on good practices.
DESIGN SYSTEM
Re-design and document all User Interface Elements. Define the CSS Stylesheet Library. Push changes to the UI Dev Repo. The user interface was built based on Atomic Design.
ATOMS: Single elements of the UI documented on the Design System.
MOLECULES: Groups of information = Device ID.
ORGANISMS: Groups of Molecules = All Devices.
TEMPLATES: Groups of Molecules repeated across various pages. = All Devices with Low Battery.
PAGES: Sets of templates required by all types of users. = Devices Overview, with all their forming attributes.


WIREFRAMES
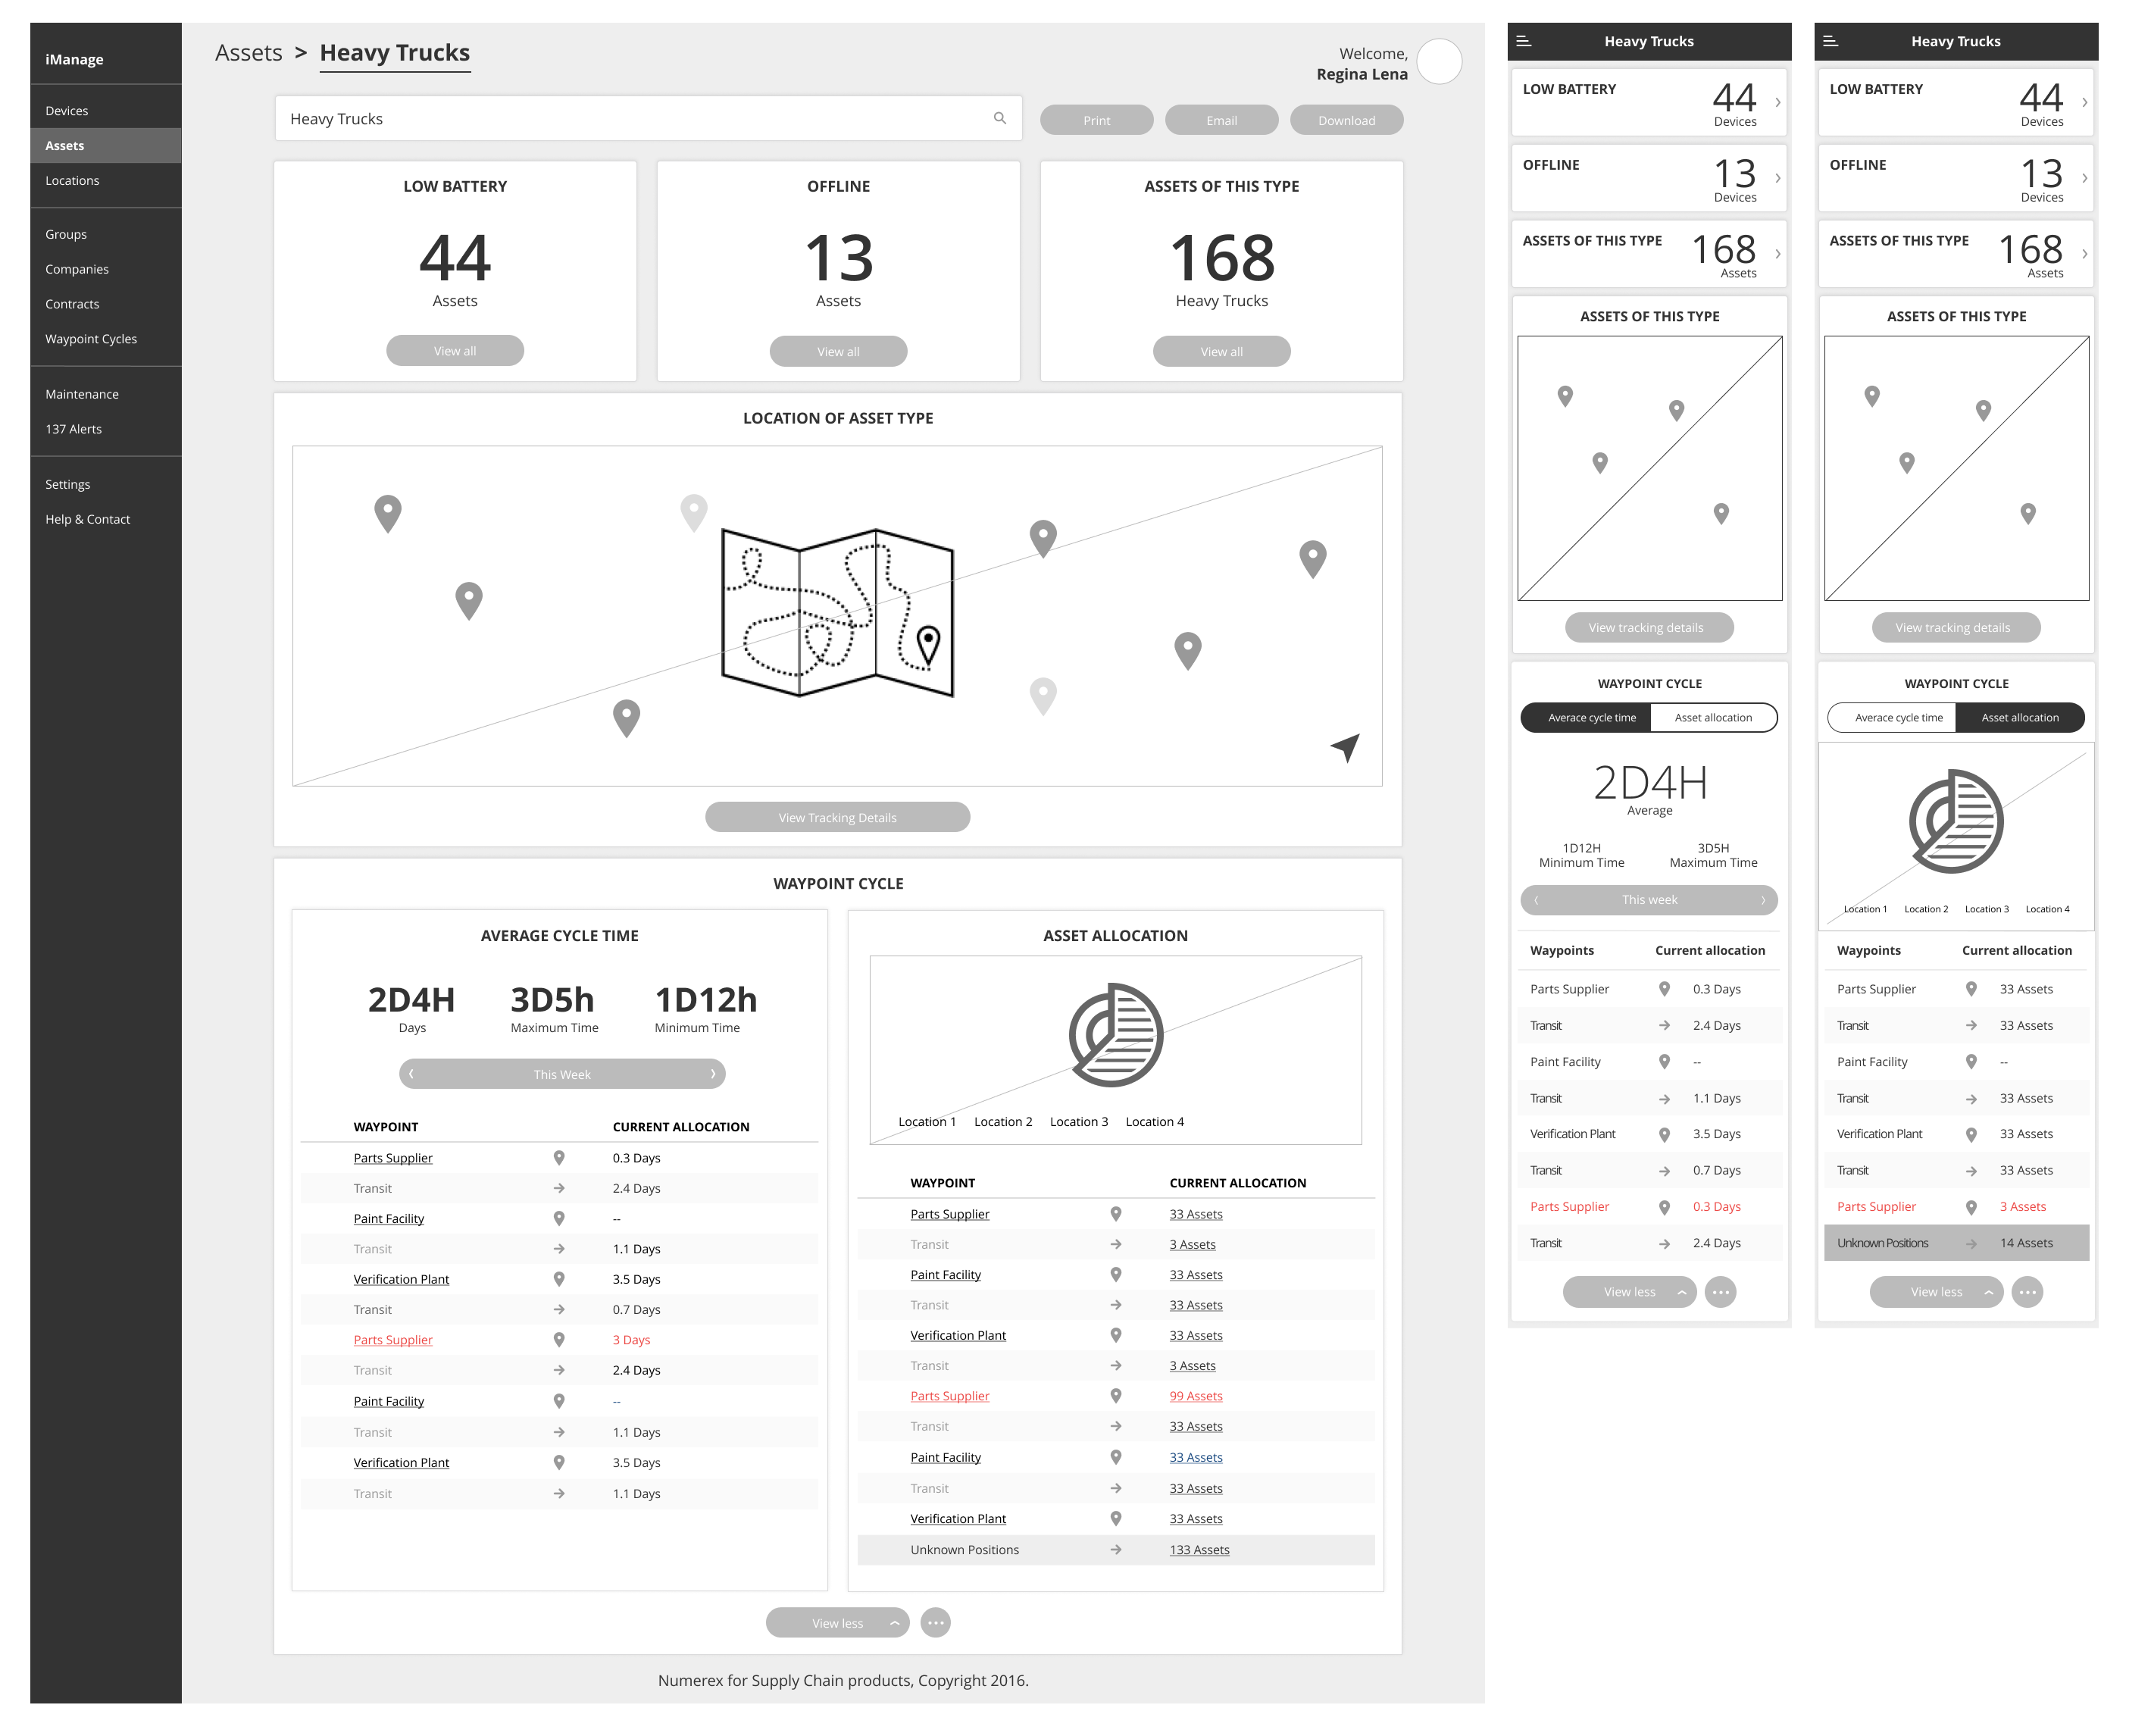
Designing the application wireframes in black and white while using UI templates, allowed me to iterate and quickly validate that the most important pieces of information were present.
USER INTERFACE AND INTERACTION DESIGN UI & UX
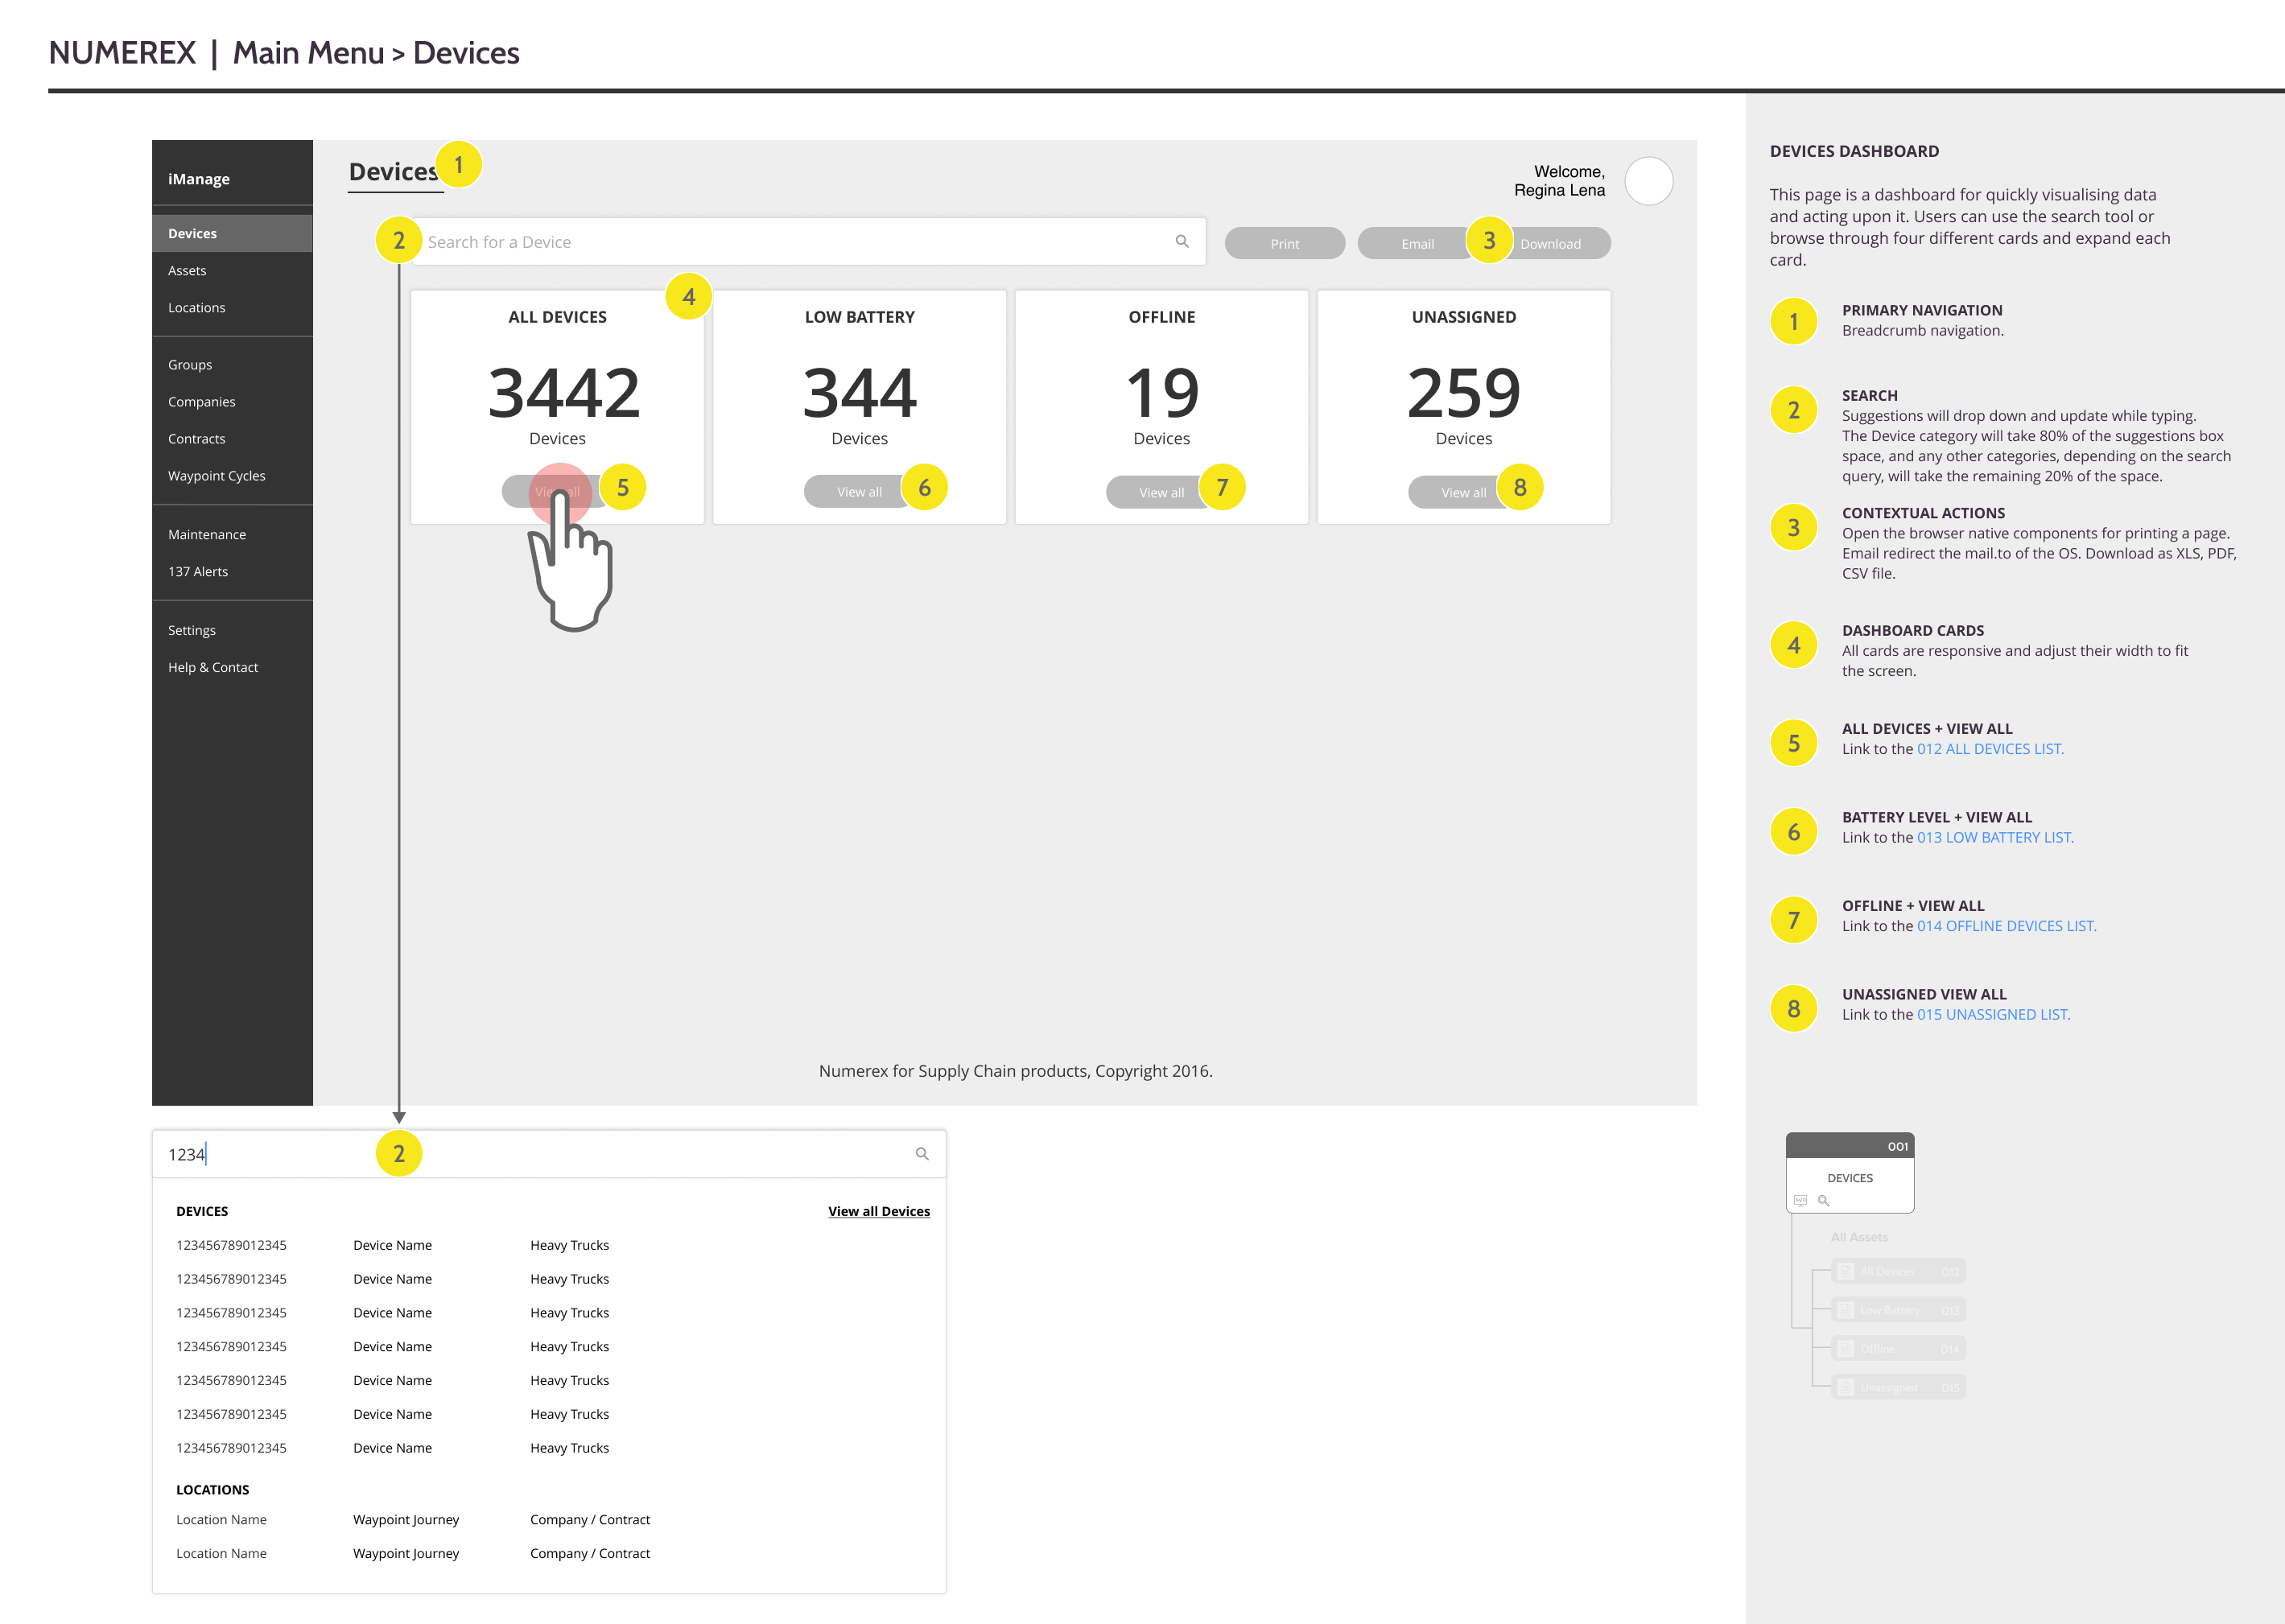
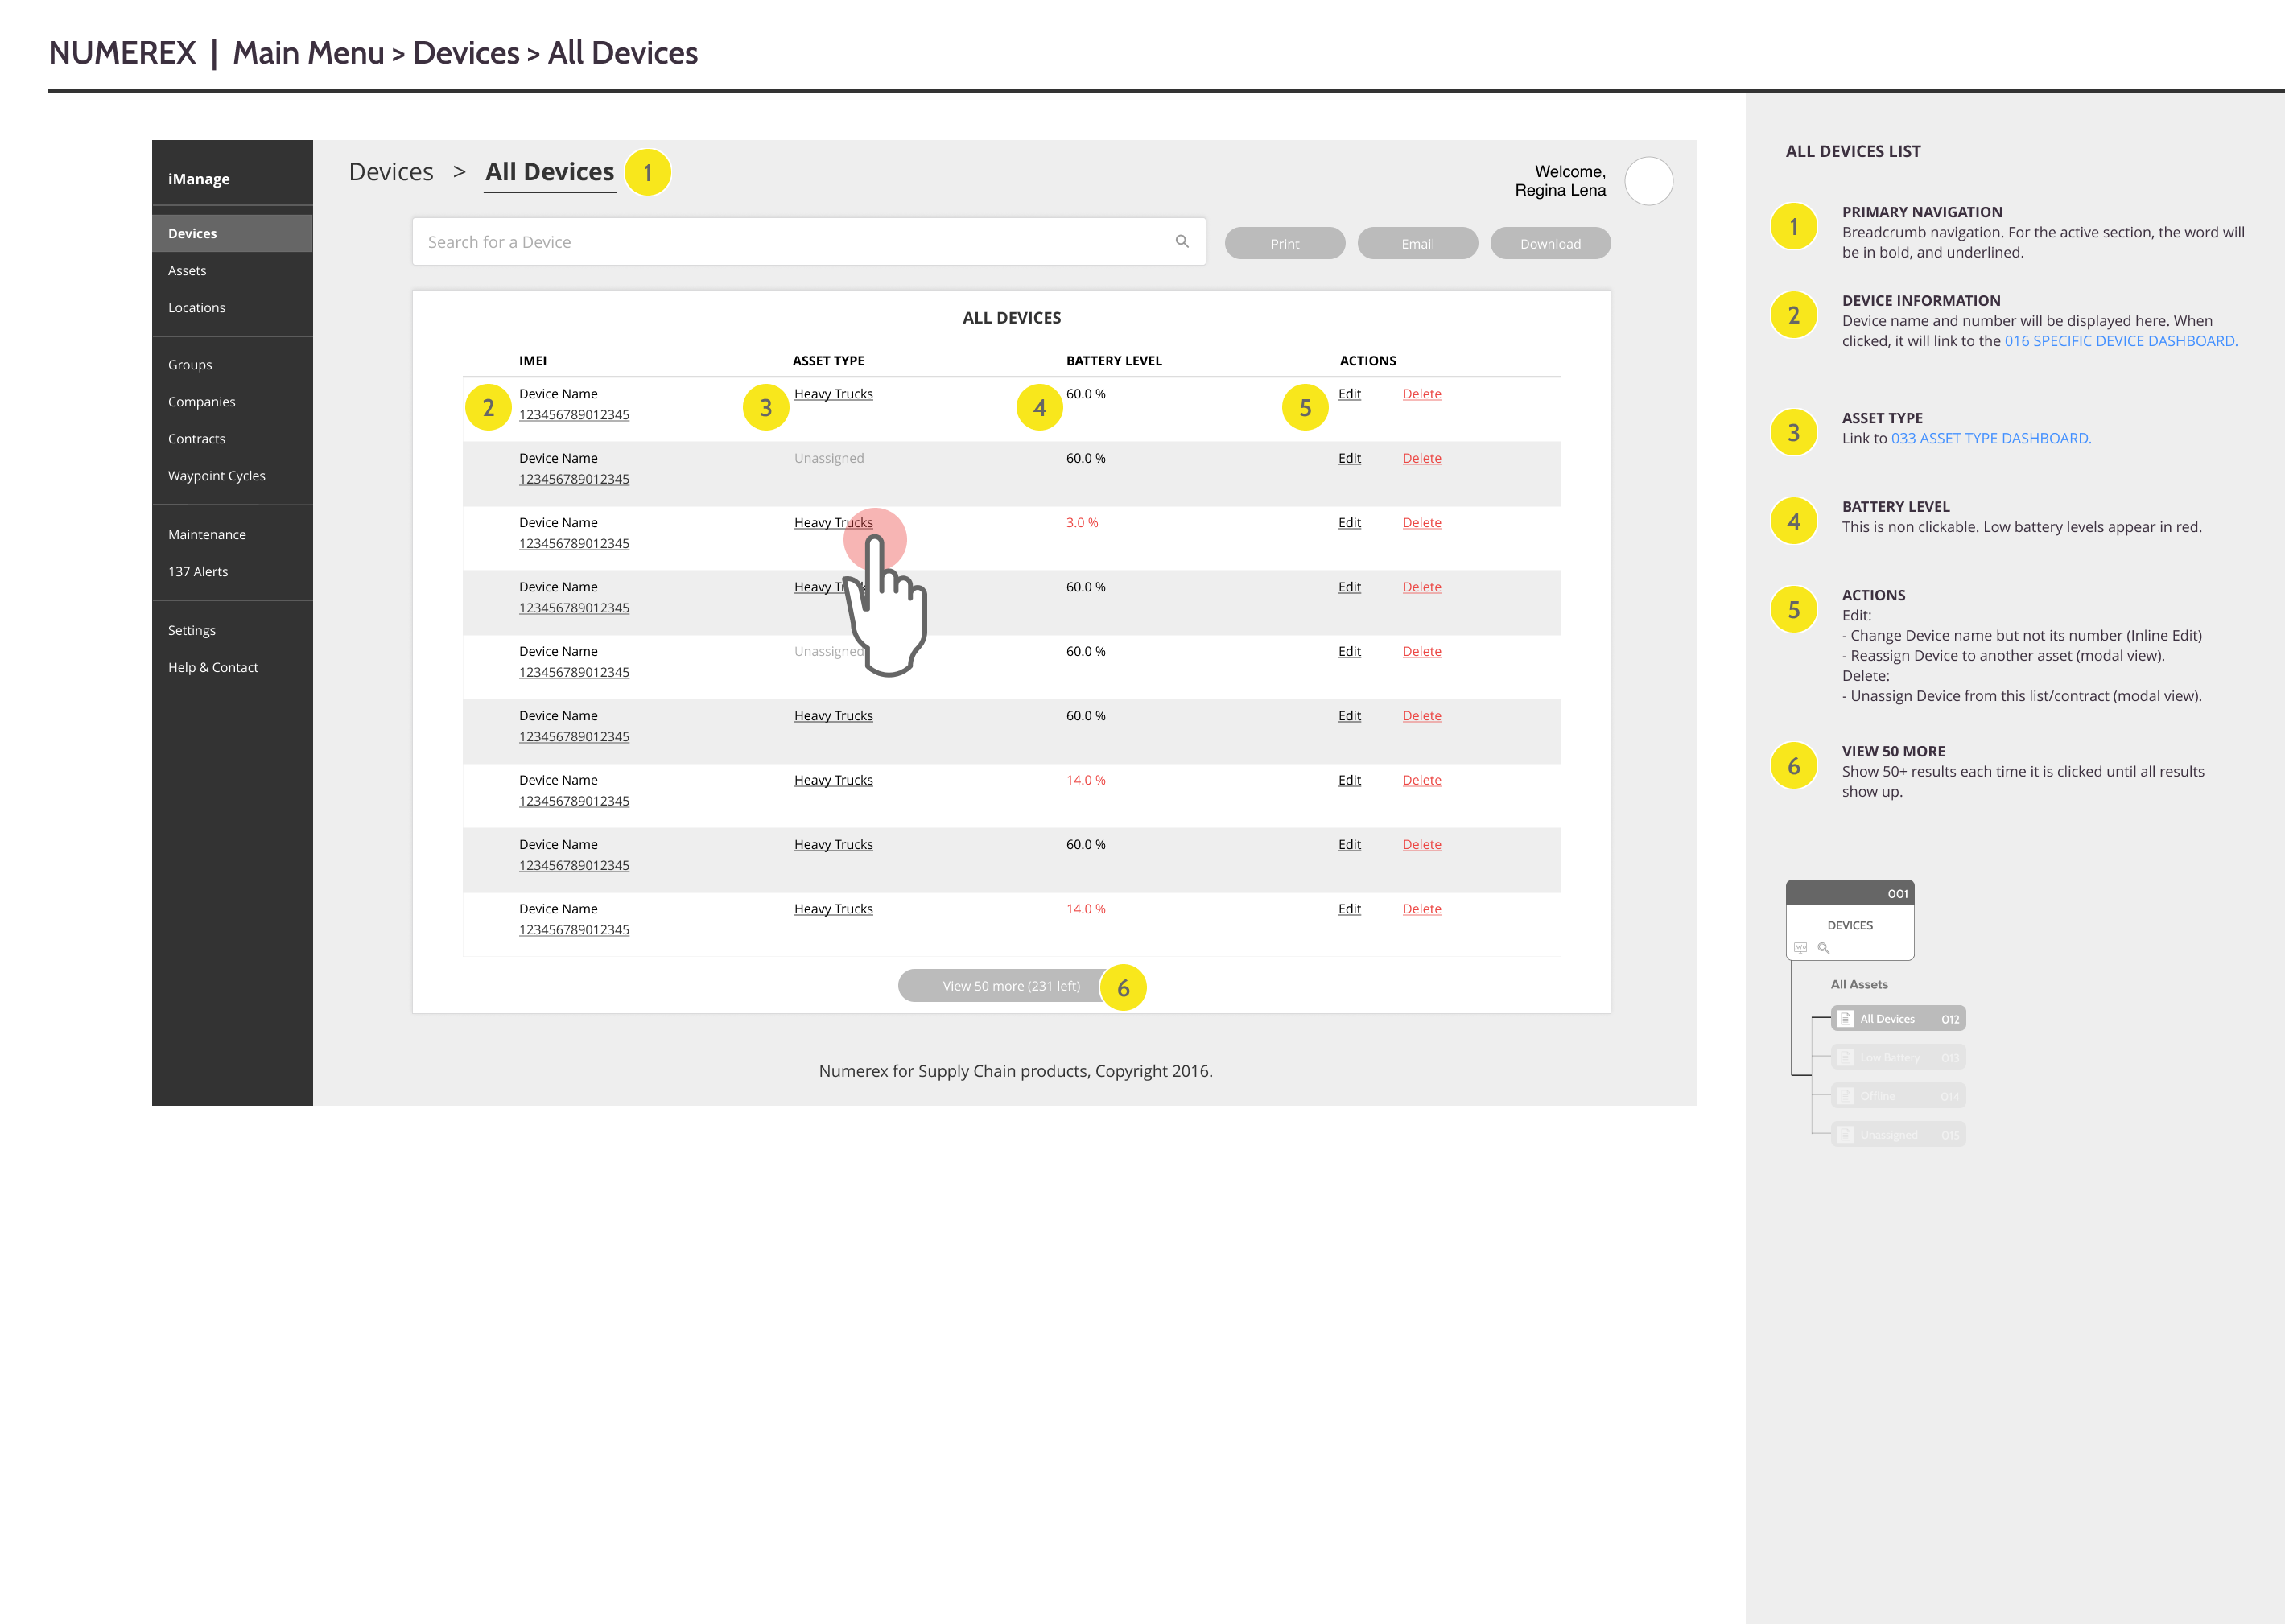
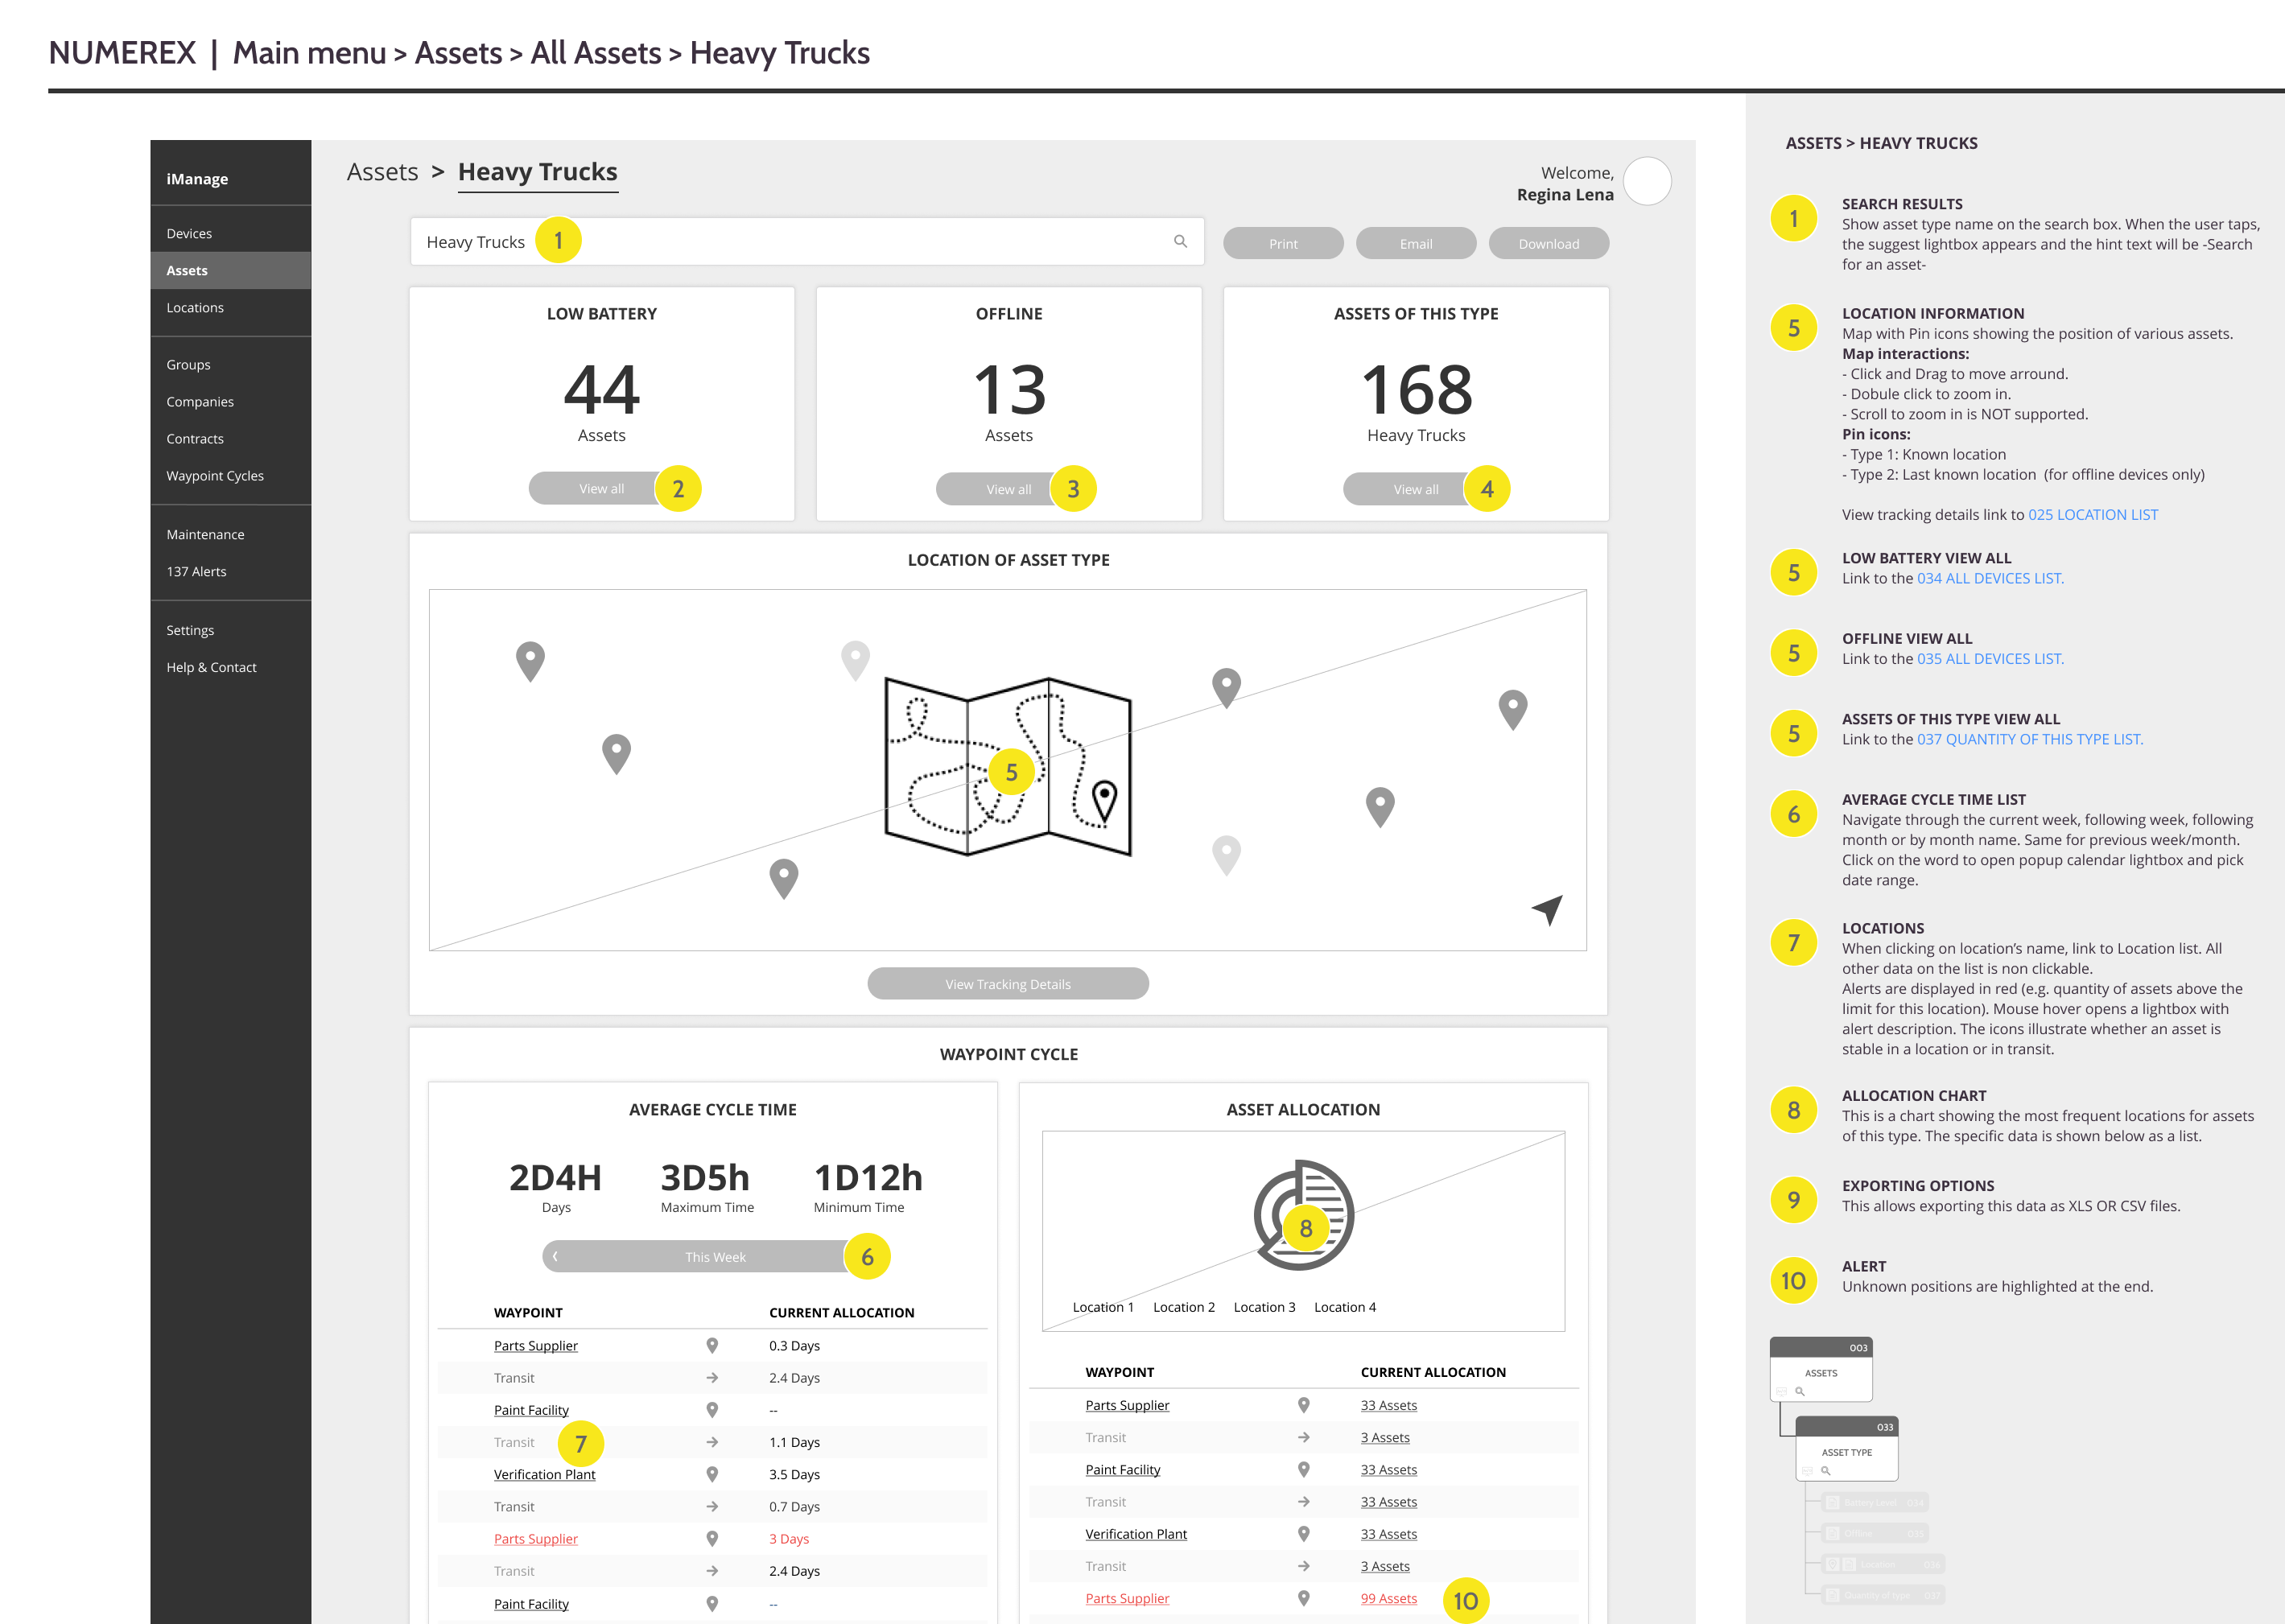
Once the new architecture was defined, I created a detailed documentation to explain the new user journeys. Adding specific comments to each user interface elements (UI) this documentation describes each element’s interaction (IxD). The documentation was the result of several conversations and iterations with the development team over calls, Slack and InVision.
FUNCTIONAL PROTOTYPE
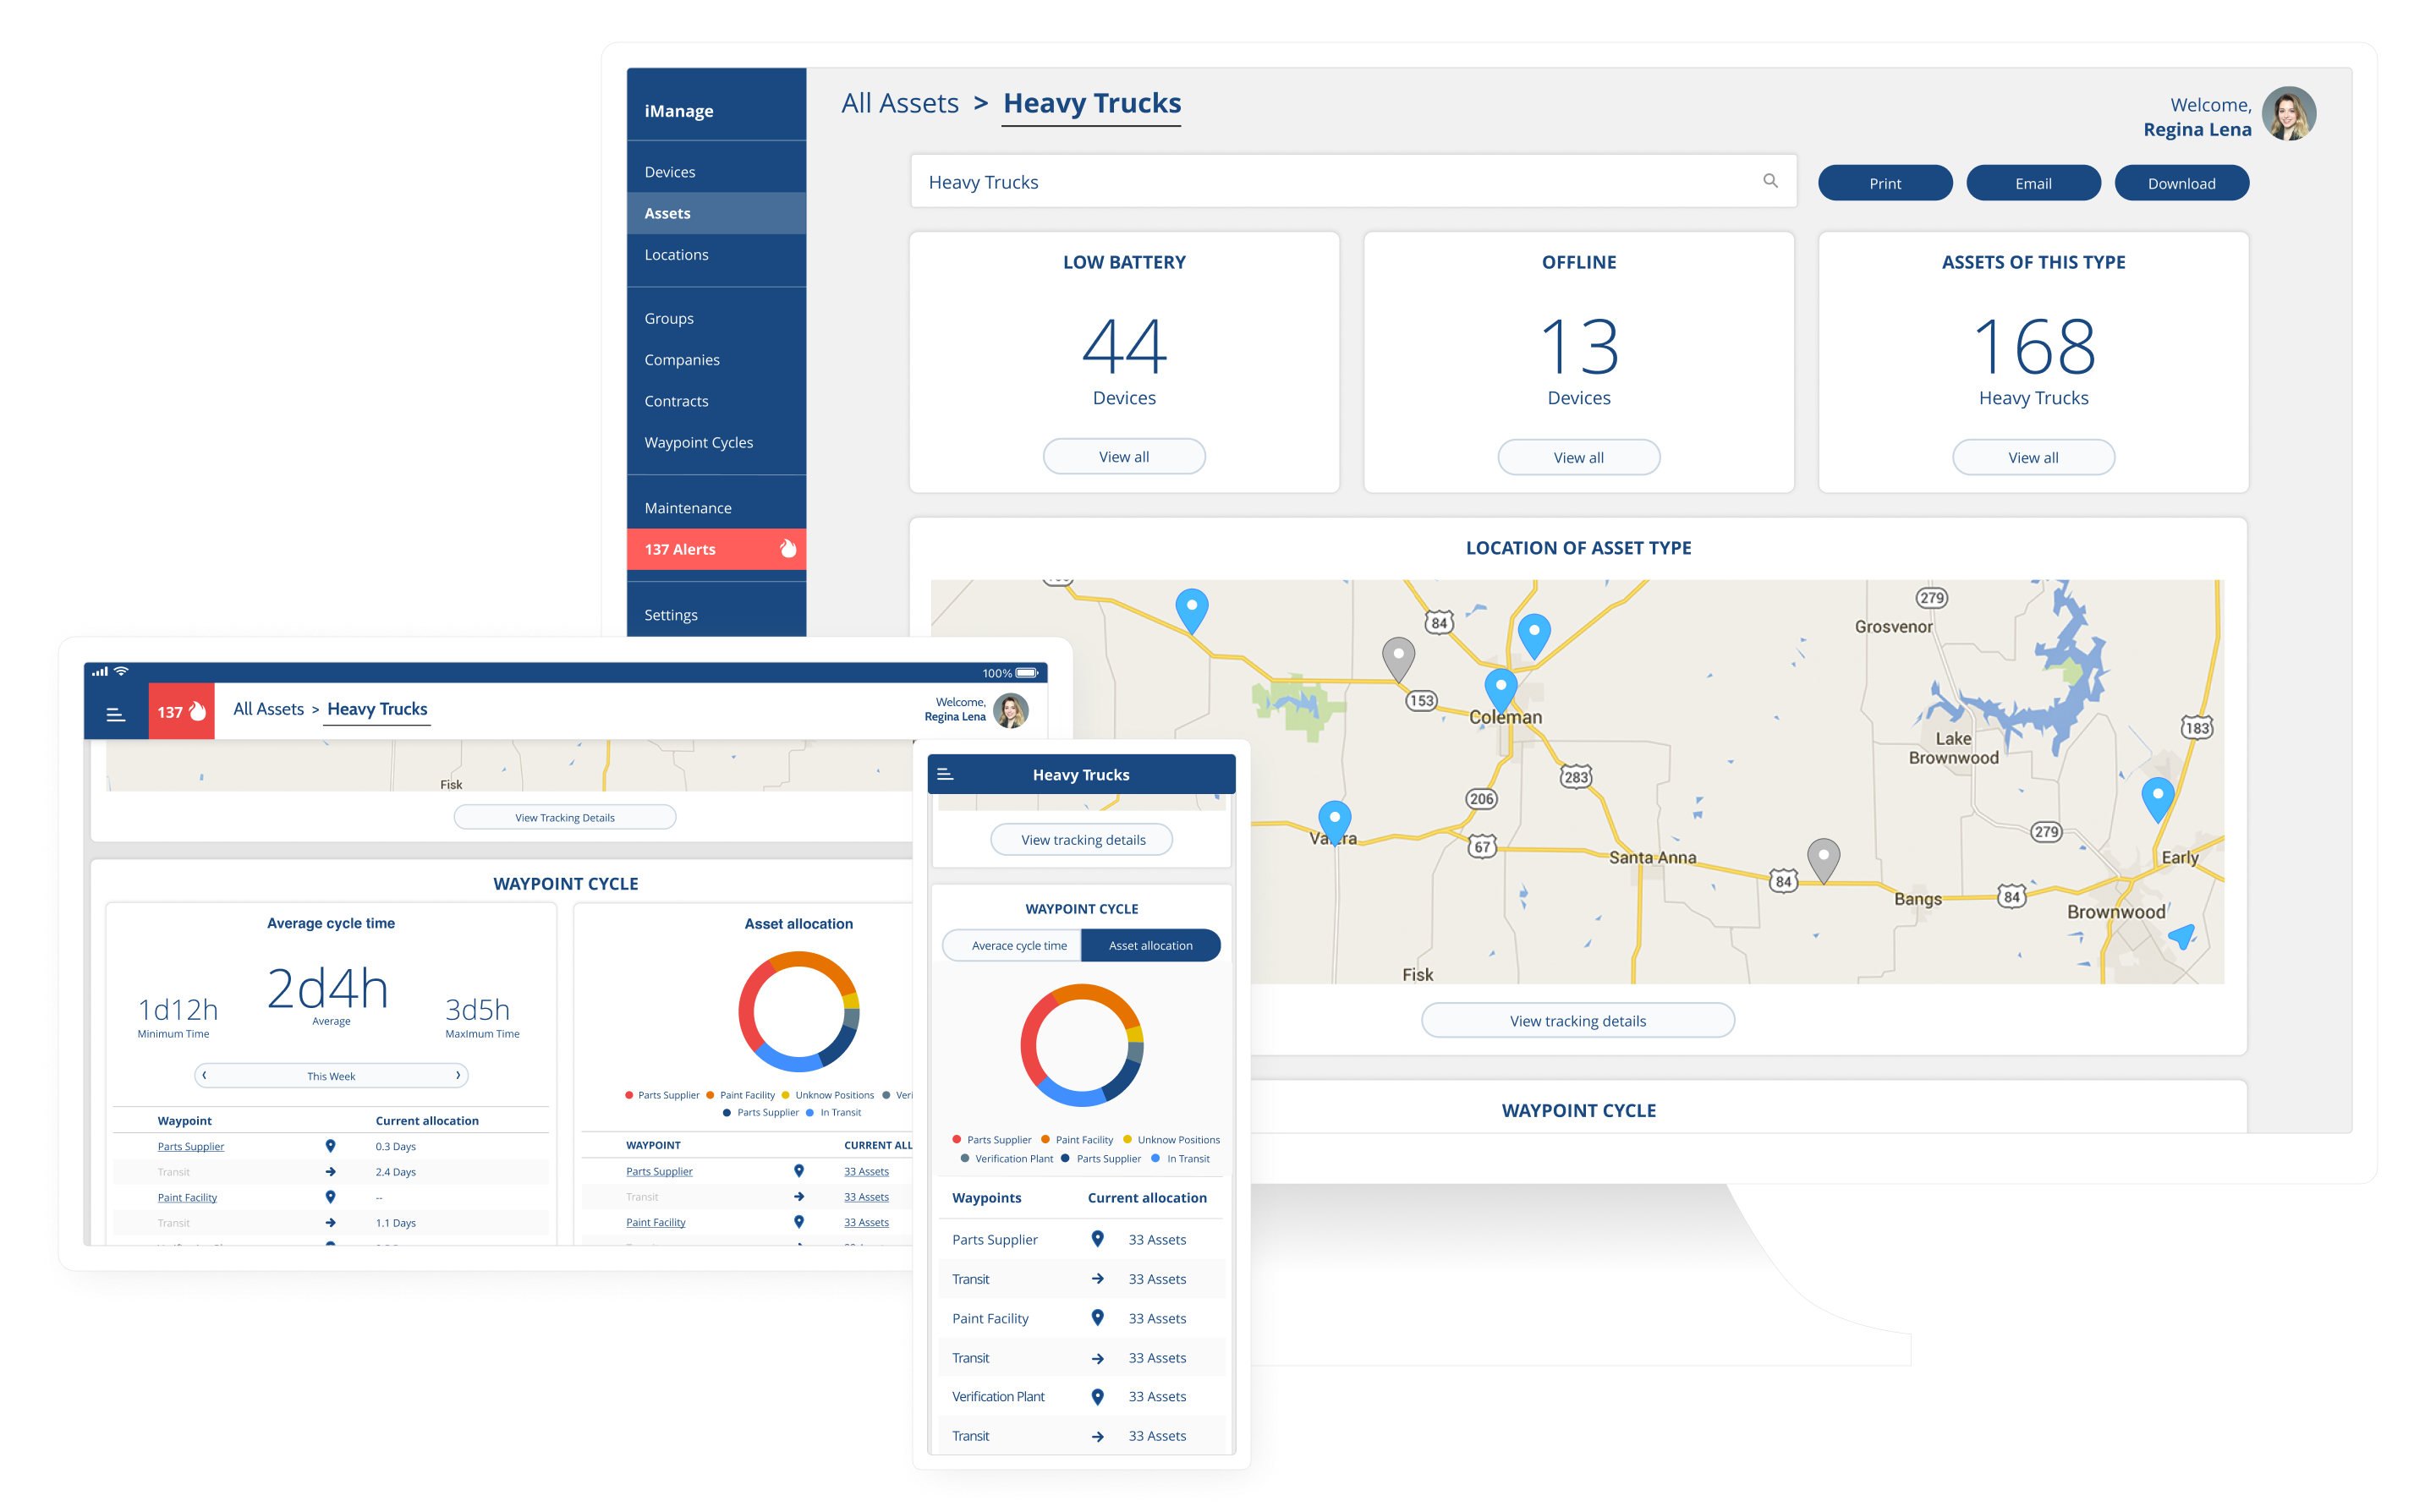
As a result of the wireframe, a prototype was created to understand the navigation and functionality of each element. This process was crucial to assess the feedback of developers, the client stakeholder, and the customer needs.
RESPONSIVE DESIGN
Numerex Dashboards required four breakpoints: TV for corporate presentations, Desktop for Managers, and Tablet and Mobile for Employees in the field.
MENTORING
Assisting the team in technical difficulties and collaborate with the definition of style guides and libraries used.
During this process, the Numerex team did not have an analytics solution that allowed my team to measure user feedback. I would track in future iterations: task completion rate, average time-on-task for top user journeys, error rate, and report export frequency.
Special thanks to Gabriel Fagundez, BJ Allen, and our team of Engineers and Developers, for all their support, feedback and trust.